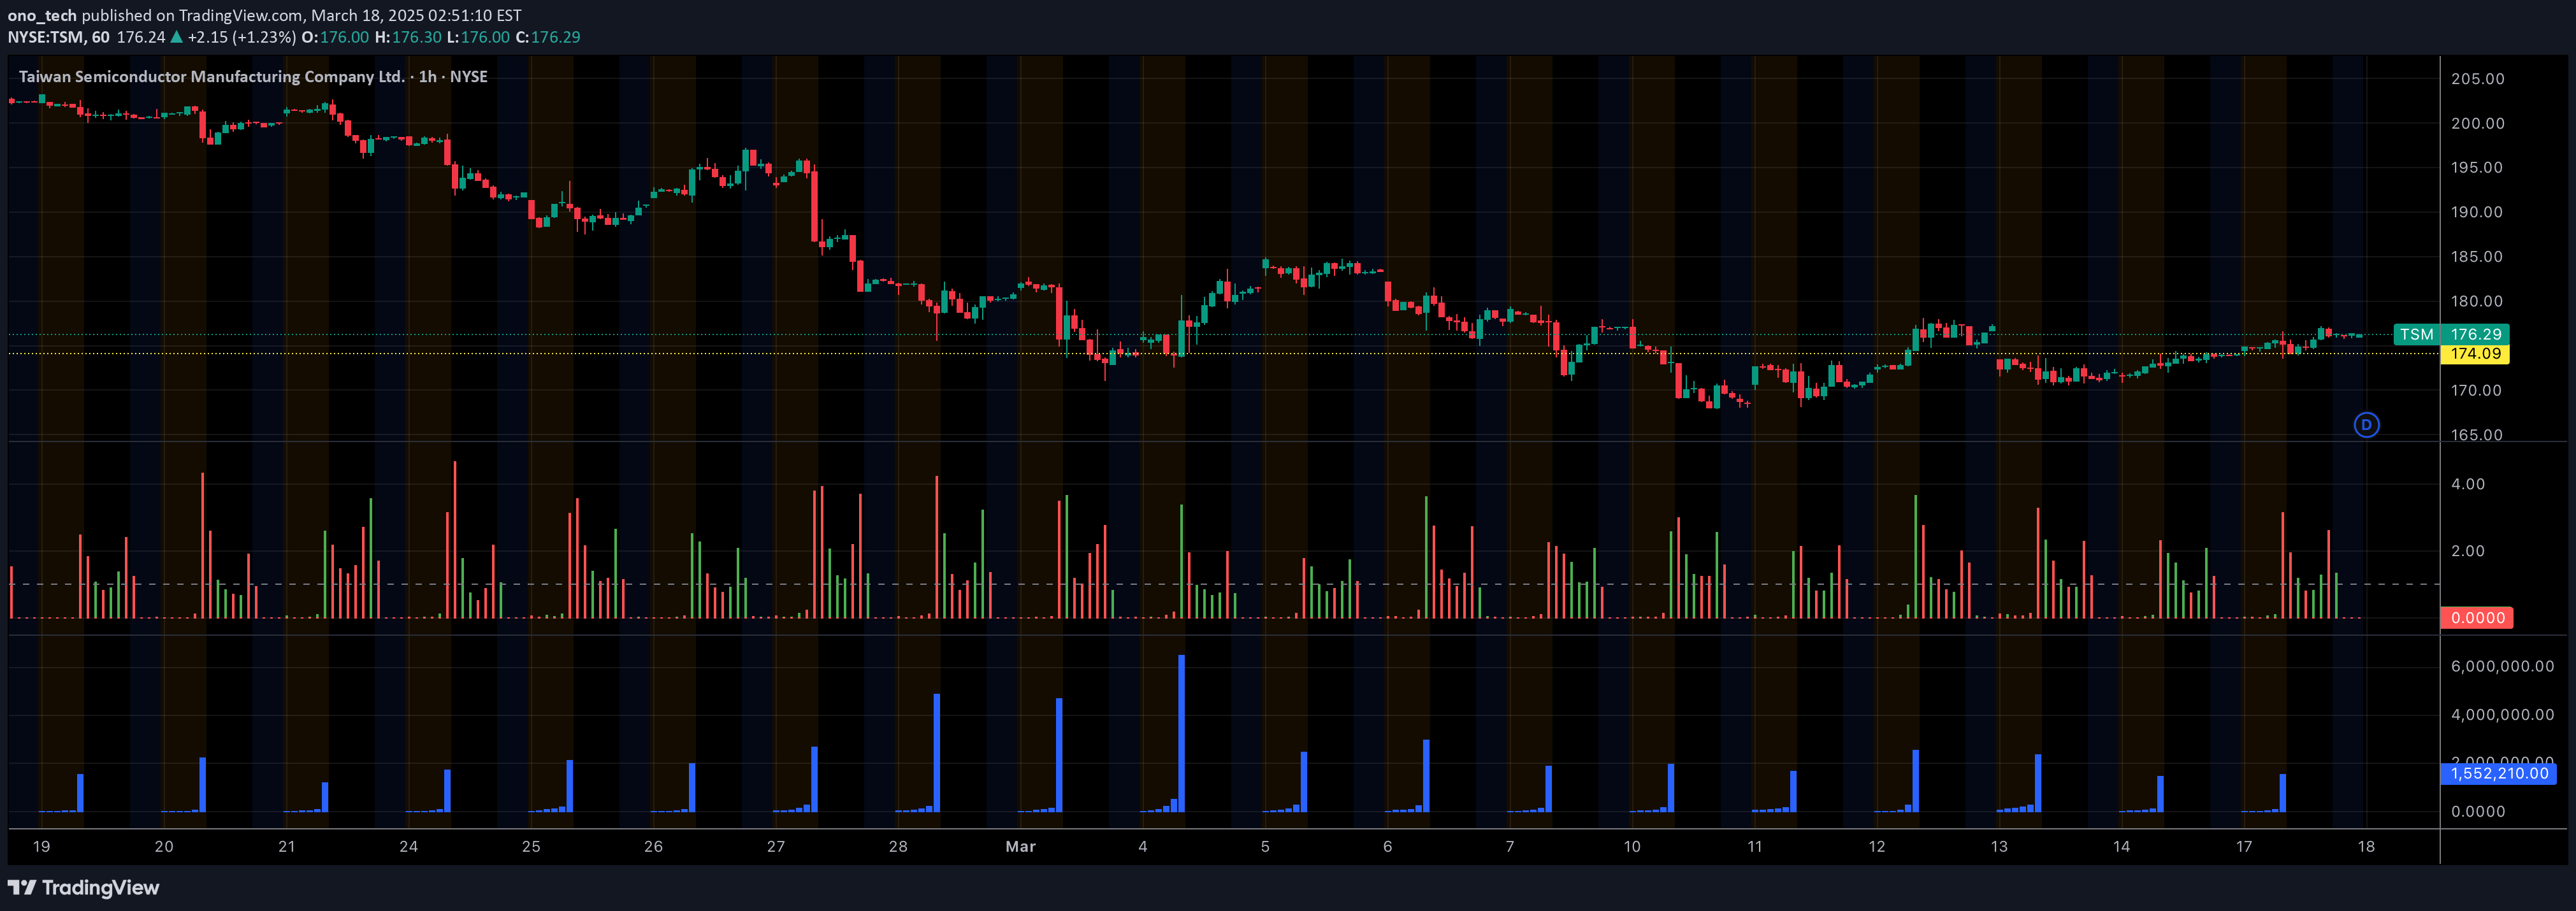
A trading signal that identifies potential stock breakouts by analyzing percentage price change and volume, using specific conditions to highlight trading opportunities.
Explore complementary indicator rolesHow it works
The Pocket Pivot Breakout Indicator generates a blue arrow when two specific conditions are met simultaneously. First, the stock must experience a daily percentage change greater than 3% from its opening price. Second, the trading volume on that day must exceed the highest red volume from the previous 10 days.
This indicator is based on the pocket pivot concept developed by Gil Morales and Chris Kacher, designed to identify potential breakout moments in stock movement. By combining price movement and volume analysis, the signal aims to highlight stocks showing significant momentum and potential trading opportunities.
Why it may be useful
The Pocket Pivot Breakout Indicator provides traders with a visual and quantitative method to identify potential stock breakouts and momentum shifts. By integrating percentage price change and volume metrics, the signal helps traders recognize stocks that are experiencing substantial price movement and strong trading interest.
This approach allows traders to make more informed decisions by focusing on stocks demonstrating both price strength and significant trading volume. The indicator can help identify potential entry points for new positions or continuation of existing trades, especially when stocks are breaking out from established chart patterns.
When to explore it
The Pocket Pivot Breakout Indicator is most effective when used in conjunction with other technical analysis tools and fundamental stock research. It works best when identifying stocks breaking out of proper bases like cup and handle or Darvas box formations, providing confirmation of potential trend continuation.
Traders should use this indicator as part of a comprehensive trading strategy, considering market conditions, stock fundamentals, and additional technical signals. It is particularly useful for traders seeking to enter or add to positions in fundamentally strong stocks showing clear momentum and volume confirmation.
Keep exploring
What we’ve verified
Access, alerts and repainting behaviour have not been independently verified for this indicator. Check the creator’s current publication and settings.
General descriptions and classifications are recovered research. Verified details above identify the specific checks we have completed. Check the creator’s current publication for later changes.