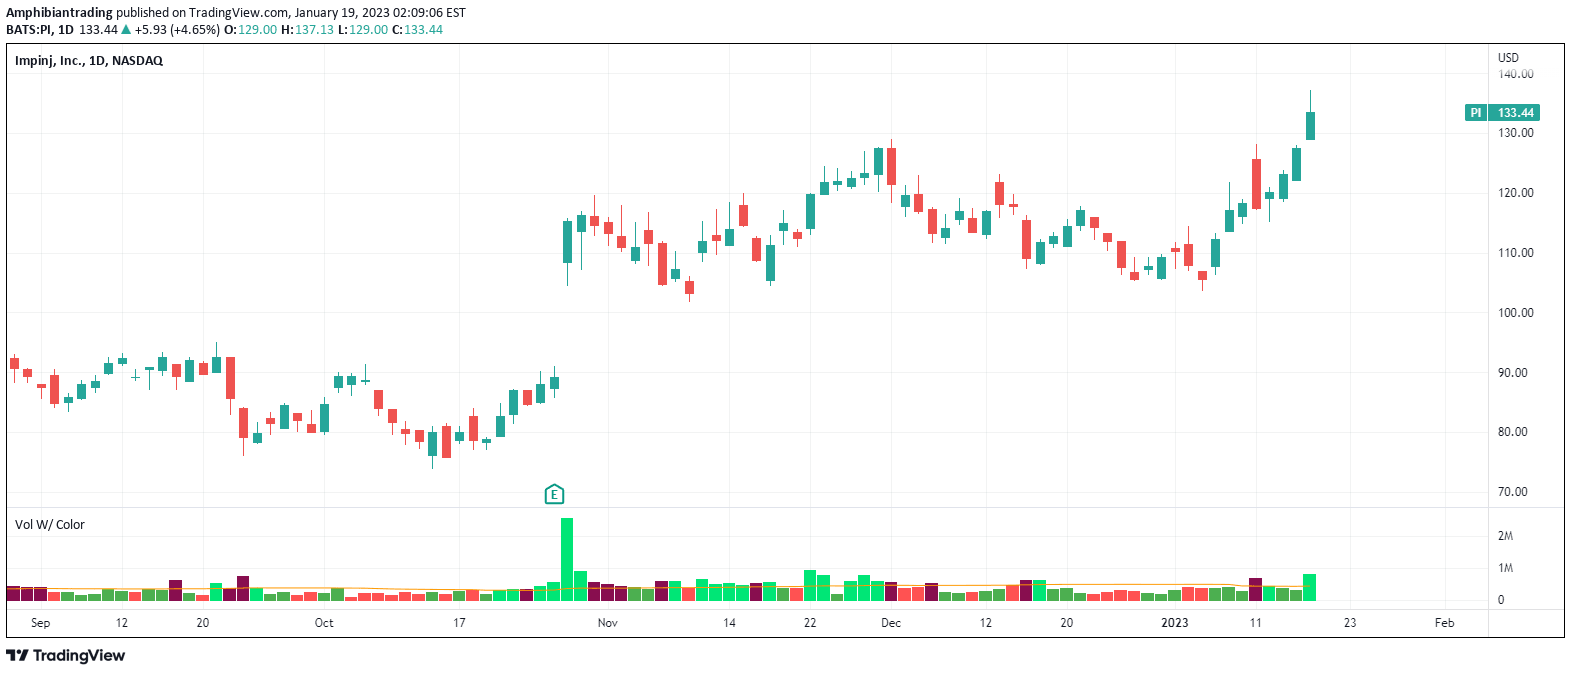
A volume-based indicator that highlights accumulation and distribution days by color-coding volume bars, helping traders quickly identify potential trend strength and market sentiment.
Explore complementary indicator rolesHow it works
The volume indicator tracks daily price movement and trading volume, comparing it against a user-selected average volume threshold. When an up day occurs with volume higher than the average, it is marked as an accumulation day, signaling potential bullish sentiment. Conversely, when a down day has volume exceeding the average, it is classified as a distribution day, potentially indicating bearish market conditions.
By dynamically color-coding volume bars based on these criteria, traders can quickly visually assess the underlying market dynamics without extensively analyzing raw data. The indicator provides an intuitive method to understand buying and selling pressure during different trading sessions.
Why it may be useful
Volume analysis is crucial for understanding market sentiment and confirming price movements. By highlighting accumulation and distribution days, traders can gain insights into potential trend strength and institutional investor behavior. These color-coded signals help identify when significant market participants are actively buying or selling, which can precede major price shifts.
The visual representation allows traders to quickly interpret complex volume data, reducing analysis time and providing immediate context about market dynamics. This approach helps traders make more informed decisions by offering a quick, intuitive understanding of market momentum and potential trend reversals.
When to explore it
This volume indicator is most effective in markets with consistent trading volume and clear price trends. It works best for traders seeking to confirm trend strength and identify potential trend reversals through volume analysis. Active markets like stocks, futures, and forex benefit most from this visual volume tracking method.
Traders should use this indicator in conjunction with other technical analysis tools to validate signals and reduce false positives. It is particularly useful during periods of market transition, helping identify potential shifts in market sentiment before significant price movements occur.
Keep exploring
What we’ve verified
Access, alerts and repainting behaviour have not been independently verified for this indicator. Check the creator’s current publication and settings.
General descriptions and classifications are recovered research. Verified details above identify the specific checks we have completed. Check the creator’s current publication for later changes.