
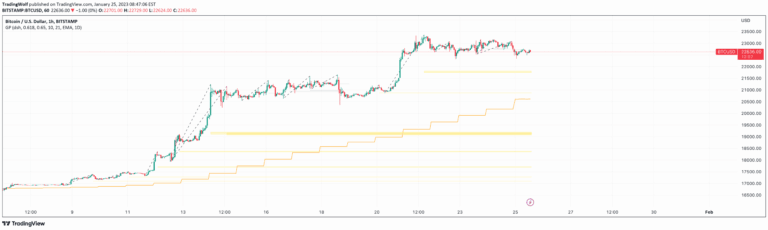
Golden Pocket
Golden Pocket is a Fibonacci retracement tool that identifies key price levels between 0.618 and 0.65, helping traders find potential entry points during market retracements.
Explore 11,183 indicators. Filter beyond the obvious.
Discover the tools that fit the way you trade.
11,183 tools to explore
Golden Pocket is a Fibonacci retracement tool that identifies key price levels between 0.618 and 0.65, helping traders find potential entry points during market retracements.
A trading signal that identifies potential stock breakouts by analyzing percentage price change and volume, using specific conditions to highlight trading opportunities.
An automated Fibonacci retracement tool that identifies the golden pocket level from the latest pivot point, helping traders spot potential price reversal zones on higher timeframes.
A volume-based indicator that highlights accumulation and distribution days by color-coding volume bars, helping traders quickly identify potential trend strength and market sentiment.
A sophisticated technical indicator using Fibonacci sequence numbers to create dynamic moving average channels that help traders identify trend direction, potential support/resistance zones, and trade entry points.
A volume-integrated candlestick indicator that dynamically adjusts candlestick opacity based on trading volume and highlights potential stealth accumulation through pocket pivots.
An advanced volume indicator that provides detailed volume analysis with color-coded volume bars, moving average insights, and unique volume labeling for comprehensive market trend assessment.
A comprehensive swing trading indicator that provides adaptive moving averages, price contraction detection, resistance line tracking, and detailed trading information across multiple timeframes.
Advanced volume analysis tool tracking institutional trading activity, revealing market structure through volume profiles, highlighting key price levels, and detecting significant trading patterns.
An advanced volume analysis tool that detects volume dry-ups, pocket pivots, and provides comprehensive volume insights to help traders identify potential trading opportunities.
A trading strategy combining Volatility Contraction Pattern (VCP) and Pocket Pivots to identify potential breakout opportunities by analyzing price consolidation and volume surges.
Advanced volume analysis indicator tracking institutional trading activity through multiple volume patterns, detecting potential accumulation, distribution, and market trend shifts.
Likes, views, and comments are historical TradingView snapshots. They describe attention, not trading performance.