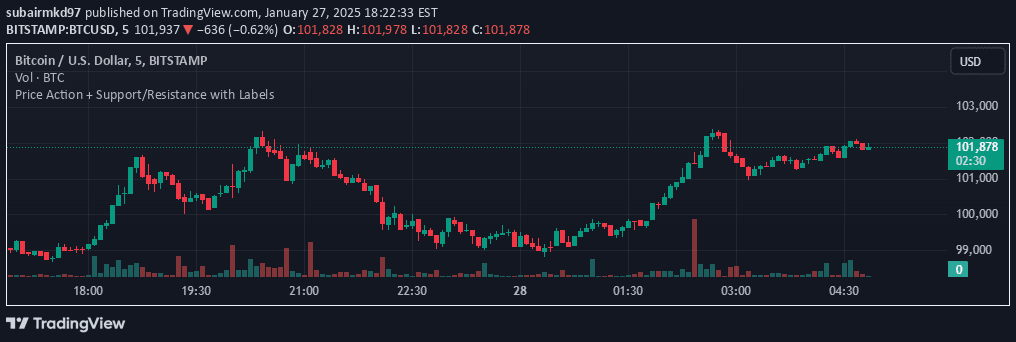
A comprehensive swing trading indicator that provides adaptive moving averages, price contraction detection, resistance line tracking, and detailed trading information across multiple timeframes.
Explore complementary indicator rolesHow it works
The Swing Trend Analyzer operates by integrating multiple technical analysis techniques to provide traders with comprehensive market insights. It uses adaptive moving averages that can be customized across different timeframes, allowing traders to fine-tune their analysis based on specific trading strategies and preferences.
The indicator also employs sophisticated detection mechanisms like price contraction identification, automated resistance line drawing, and pocket pivot markers. These features work together to highlight potential trading opportunities by analyzing price movements, volume characteristics, and relative strength against benchmark indices.
Why it may be useful
The Swing Trend Analyzer matters because it consolidates complex technical analysis into a user-friendly, visually intuitive tool that helps traders make more informed decisions. By providing multiple layers of market information, such as sector context, moving average relationships, and price range analysis, traders can quickly assess a stock's potential and trading dynamics.
Moreover, the indicator's ability to detect nuanced signals like buyable gap ups, pocket pivots, and price contractions gives traders a competitive edge in identifying high-probability trading opportunities across different market conditions and timeframes.
When to explore it
The Swing Trend Analyzer is most effective when used for swing and positional trading strategies, particularly in markets with clear trend characteristics and moderate volatility. Traders should leverage this tool when seeking to identify stocks with strong momentum, sector leadership, and potential breakout patterns.
It is particularly useful during periods of price consolidation, when detecting subtle shifts in market dynamics can provide early entry signals. Traders should combine the indicator's insights with other technical and fundamental analysis to validate trading decisions and manage risk effectively.
Keep exploring
What we’ve verified
Access, alerts and repainting behaviour have not been independently verified for this indicator. Check the creator’s current publication and settings.
General descriptions and classifications are recovered research. Verified details above identify the specific checks we have completed. Check the creator’s current publication for later changes.