
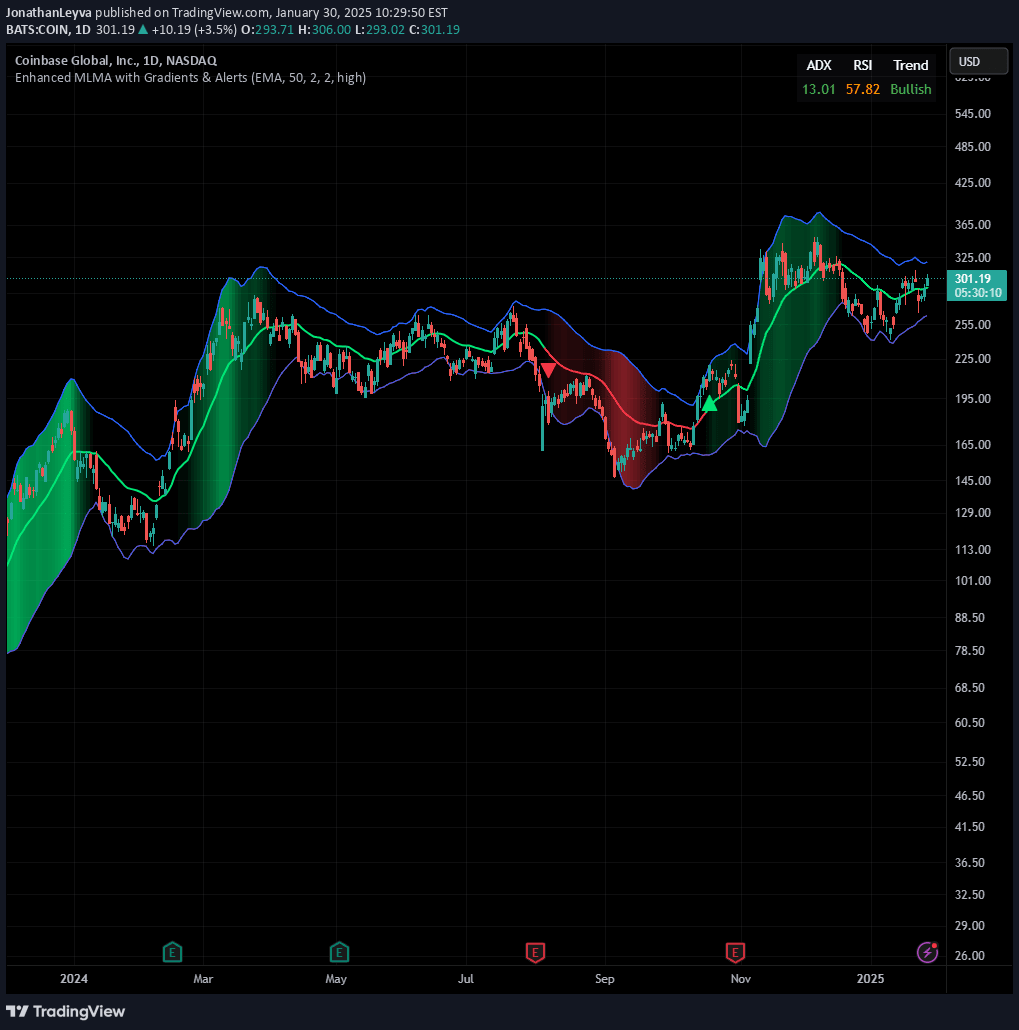
An adaptive machine learning-inspired moving average that dynamically adjusts to market conditions using multiple trend indicators like ADX, RSI, and volatility bands.
Explore complementary indicator rolesHow it works
The Machine Learning Moving Average (MLMA) uses a sophisticated approach to trend detection by dynamically selecting from four moving average types: EMA, HMA, WMA, and VWAP. It adapts its window size using Average True Range (ATR), expanding during high volatility and contracting during low volatility to maintain optimal sensitivity.
The indicator incorporates multiple trend strength filters including ADX, RSI, and Bollinger Bands to confirm market conditions. It uses intelligent trend detection mechanisms that analyze price position relative to adaptive bands, providing a comprehensive view of market momentum beyond traditional moving average calculations.
Why it may be useful
Traditional moving averages often provide lagging or static signals that fail to capture market complexity, whereas the MLMA offers a more dynamic and intelligent approach to trend analysis. By integrating multiple technical indicators and adapting to real-time market conditions, traders gain a more nuanced understanding of potential market movements.
The indicator's machine learning-inspired design allows it to 'learn' from recent price action, reducing noise and false signals. Its visual enhancements like gradient fills and trend reversal arrows make it more intuitive for traders to interpret market trends quickly and effectively.
When to explore it
The MLMA is most effective in markets with clear trending conditions, particularly when ADX indicates strong directional movement above 25. It performs exceptionally well in assets with moderate to high volatility, where its adaptive mechanisms can quickly respond to changing market dynamics.
Traders should use this indicator across multiple timeframes and asset classes, but it's particularly powerful in forex, stocks, and cryptocurrency markets. It works best when combined with additional confirmation signals like volume analysis or candlestick patterns to validate its trend detection capabilities.
Keep exploring
What we’ve verified
Access, alerts and repainting behaviour have not been independently verified for this indicator. Check the creator’s current publication and settings.
General descriptions and classifications are recovered research. Verified details above identify the specific checks we have completed. Check the creator’s current publication for later changes.


