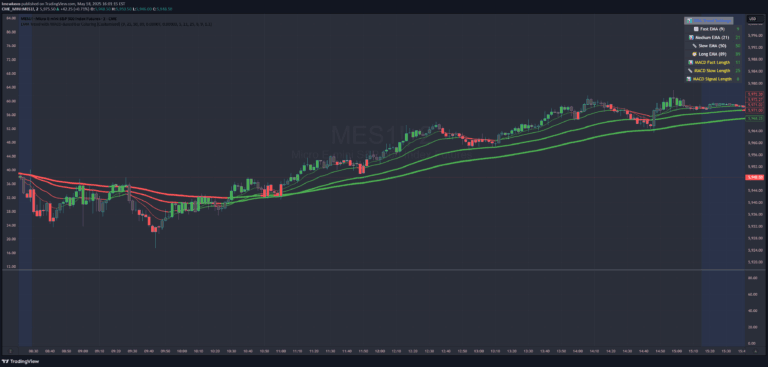
A machine learning indicator that combines password-protected market analysis levels with two powerful Geometric Moving Averages for trend identification and strategic entry points.
Explore complementary indicator rolesHow it works
The indicator utilizes two Geometric Moving Averages (GMA) at 250 and 500 periods, employing logarithmic smoothing to track market trends more effectively than traditional moving averages. These GMAs generate white and gold lines representing medium and long-term trends respectively, providing traders with a nuanced view of price movement.
Additionally, the indicator features a password-protected system that unlocks custom market analysis levels, displaying green horizontal lines for potential long entries and red lines for short entries. By entering the correct password, traders gain access to pre-defined strategic zones tailored to specific assets like cryptocurrencies and stocks.
Why it may be useful
This indicator offers traders a sophisticated approach to trend analysis by combining advanced mathematical techniques with strategic entry point identification. The Geometric Moving Averages provide superior trend tracking, especially for assets experiencing exponential growth, by using logarithmic smoothing that adapts better to volatile market conditions.
The password-protected custom levels add an extra layer of strategic insight, allowing traders to access predefined entry zones that can help minimize emotional decision-making and provide structured trading opportunities. By blending trend analysis with precise entry points, the indicator helps traders navigate complex market environments more confidently.
When to explore it
This indicator is most effective for traders seeking long-term trend analysis and strategic entry points in markets with significant price volatility, such as cryptocurrencies and technology stocks. It is particularly valuable for swing traders who aim to capture multi-day or multi-week price movements and require a comprehensive view of market trends.
The indicator works best when traders want to combine technical analysis with structured entry strategies, providing a systematic approach to identifying potential trade opportunities. Its flexibility across different assets and timeframes makes it a versatile tool for traders looking to enhance their market analysis and decision-making process.
Keep exploring
What we’ve verified
Access, alerts and repainting behaviour have not been independently verified for this indicator. Check the creator’s current publication and settings.
General descriptions and classifications are recovered research. Verified details above identify the specific checks we have completed. Check the creator’s current publication for later changes.