Dynamic Touch Trendlines [QuantVue]
Dynamic Touch Trendlines automatically draw and validate trend lines based on customizable touch requirements, helping traders identify support, resistance, and potential trend reversals.
Explore 11,183 indicators. Filter beyond the obvious.
Discover the tools that fit the way you trade.
11,183 tools to explore
Dynamic Touch Trendlines automatically draw and validate trend lines based on customizable touch requirements, helping traders identify support, resistance, and potential trend reversals.
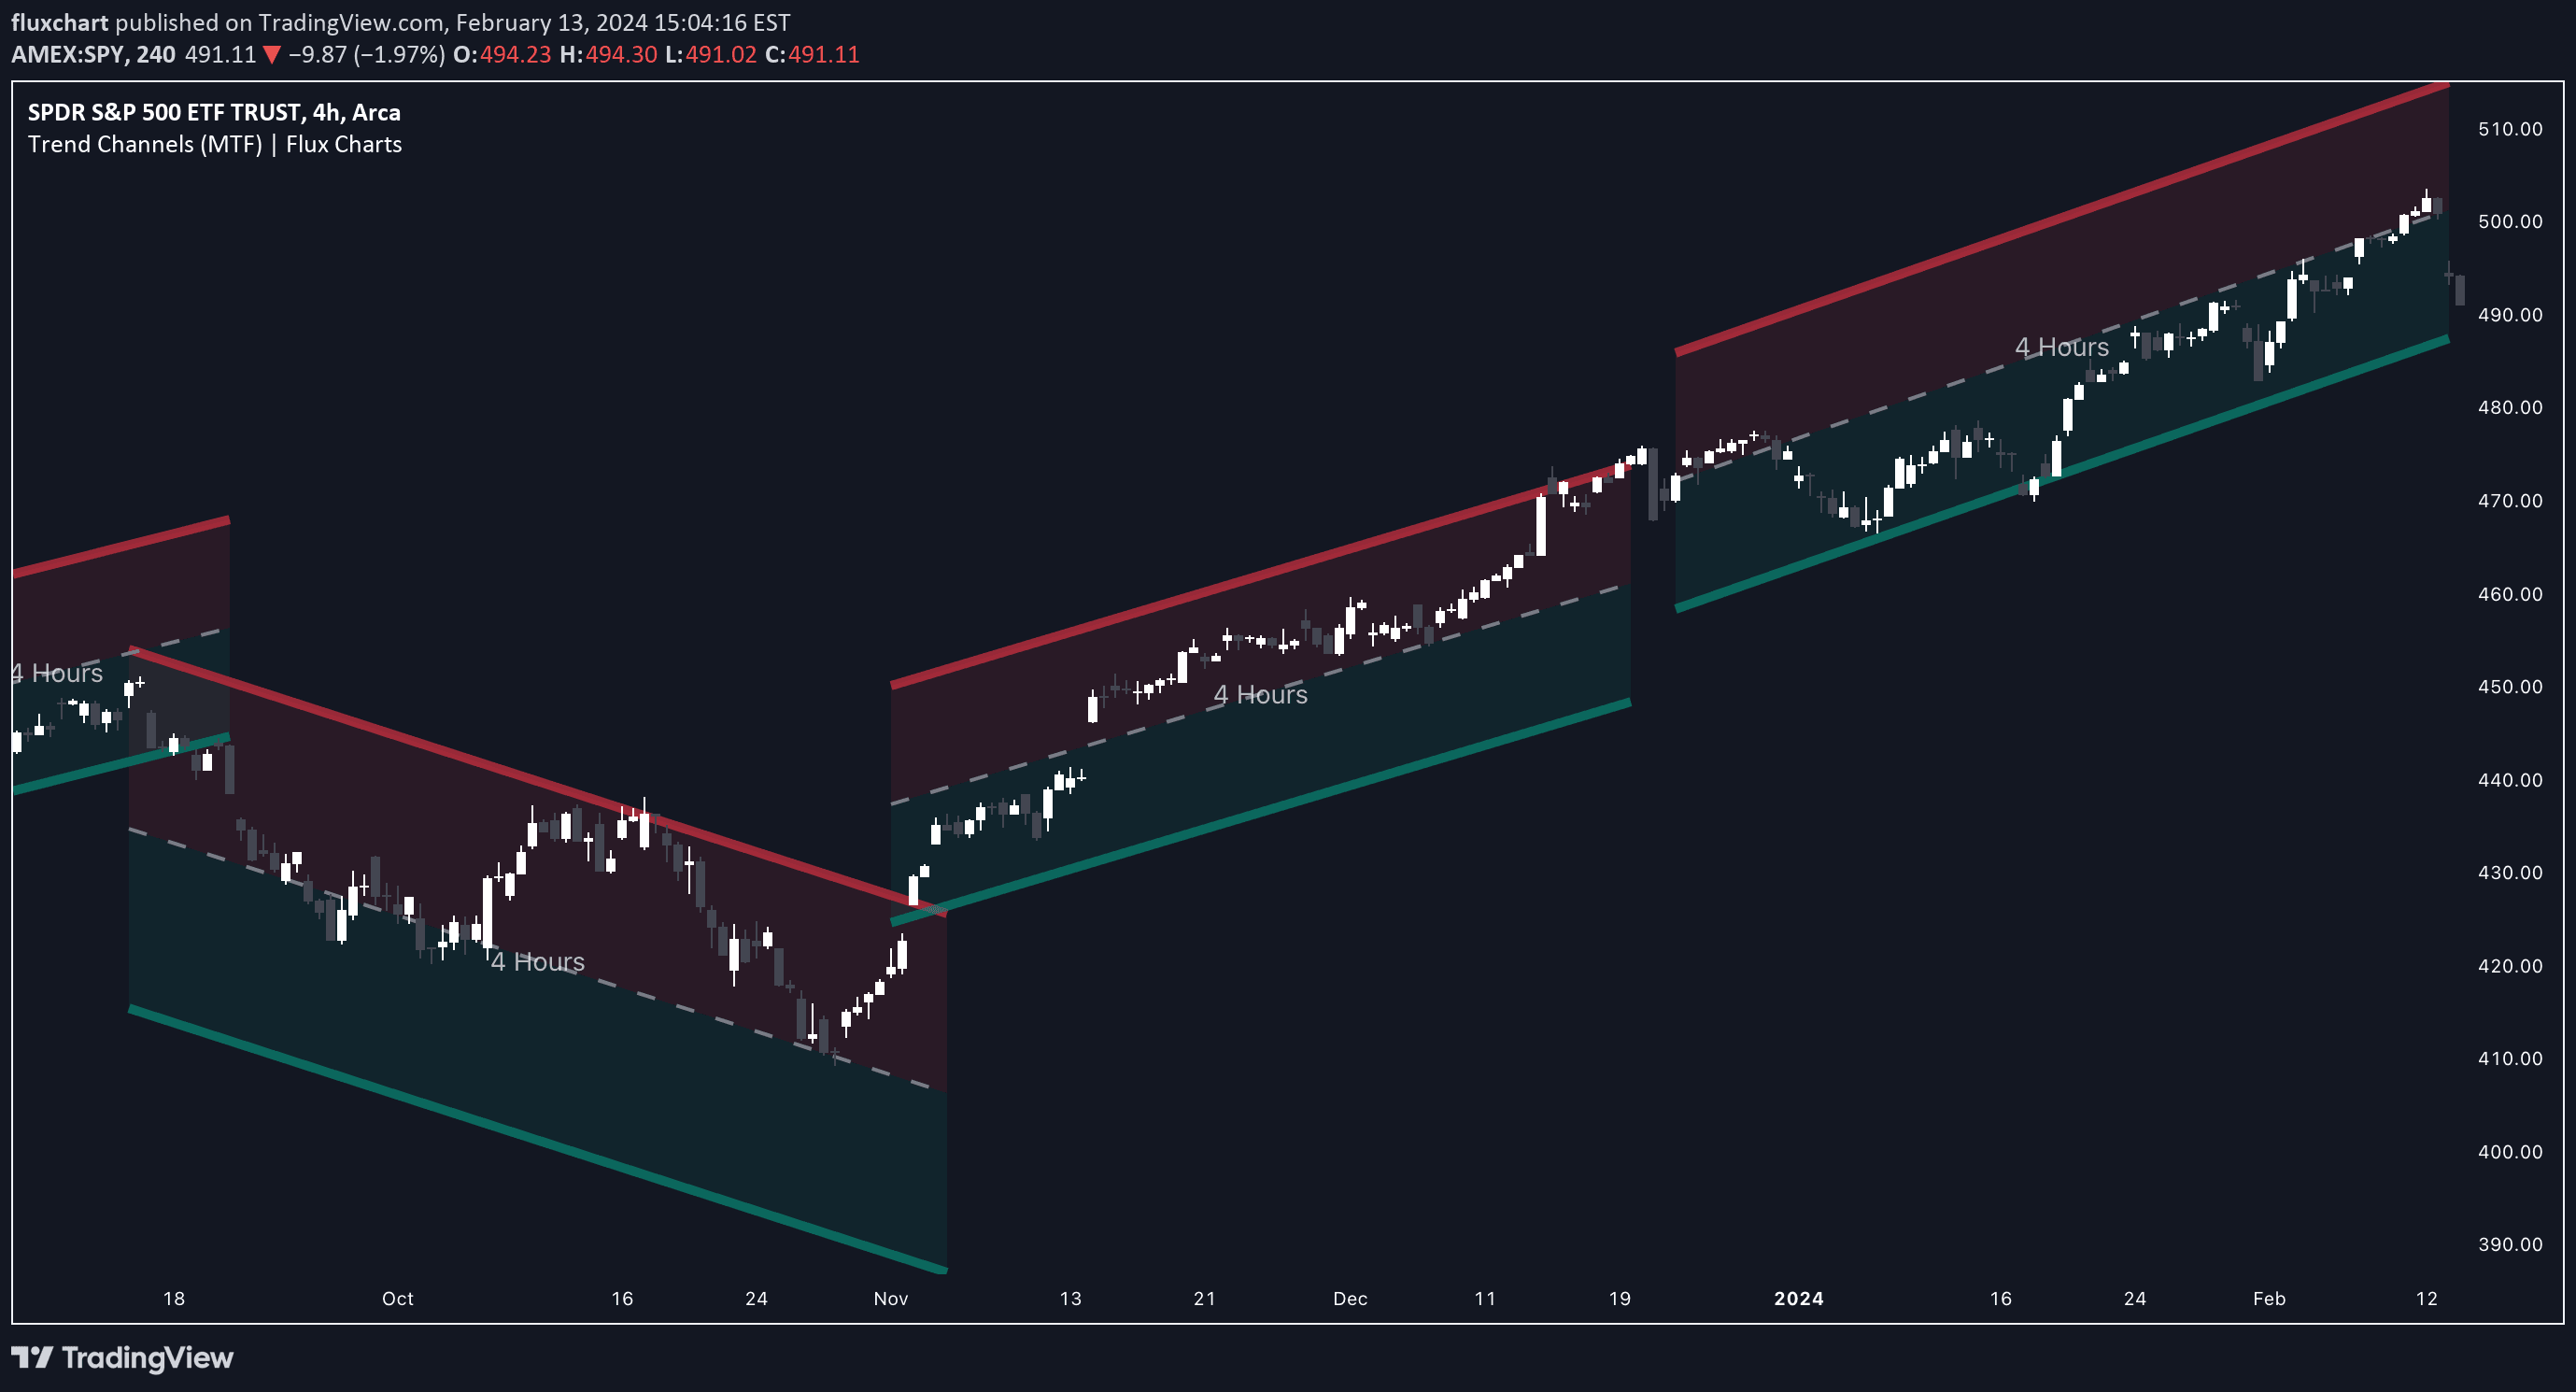
A multi-timeframe trend channel indicator that detects price trends using Simple Moving Average and helps traders identify trend direction and potential channel boundaries across different timeframes.
An advanced market structure indicator that detects swing highs and lows across multiple timeframes, providing robust insights into market dynamics and trend identification.
A trading tool that identifies engulfing candlestick patterns and volume impulses to detect potential market reversals and momentum shifts across different trend conditions.
A sophisticated statistical arbitrage tool that uses advanced mathematical techniques to detect potential market reversals by analyzing EMA relationships and statistical spread dynamics.
A TradingView indicator designed to identify sideways or ranging market conditions by analyzing price movement and volatility with customizable sensitivity parameters.
A sophisticated technical analysis tool that identifies market trends using ATR, moving averages, volume analysis, and momentum indicators to generate precise trading signals.
An advanced engulfing candle detection indicator that identifies both single and multi-candle engulfing patterns, providing comprehensive trend reversal signals for traders.
An adaptive machine learning-inspired moving average that dynamically adjusts to market conditions using multiple trend indicators like ADX, RSI, and volatility bands.
A technical analysis tool combining Choppiness Index and Custom Price Moving Average to identify market trends, volatility, and trading conditions with visual trend and momentum indicators.
VWAP is a volume-weighted average price indicator that smooths price data and provides trend insights by analyzing price movement relative to trading volume.
A multi-timeframe trend screening tool that tracks market trends across multiple assets and timeframes using moving averages to identify bullish and bearish market conditions.
Likes, views, and comments are historical TradingView snapshots. They describe attention, not trading performance.