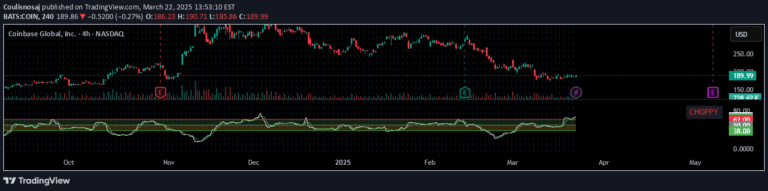
A technical analysis tool combining Choppiness Index and Custom Price Moving Average to identify market trends, volatility, and trading conditions with visual trend and momentum indicators.
Explore complementary indicator rolesHow it works
The Advanced Choppiness Indicator with CPMA operates by analyzing market volatility and trend direction through two primary components. First, the Choppiness Index calculates market volatility using Average True Range, comparing price ranges over a specified period to determine market conditions.
The Custom Price Moving Average (CPMA) complements this by creating a smooth trend line using multiple price types like close, high, and low prices. By integrating these components, the indicator generates visual cues such as histogram bars and color-coded zones that help traders quickly interpret market dynamics and potential trend movements.
Why it may be useful
This indicator provides traders with a comprehensive view of market conditions by simultaneously assessing volatility, trend direction, and momentum. By offering multiple layers of market analysis, it helps traders make more informed decisions about potential entry and exit points across different trading timeframes.
The visual representation through histogram bars, color zones, and CPMA angle allows traders to quickly understand complex market dynamics without extensive manual calculations. Its ability to highlight choppy versus trending market conditions makes it a valuable tool for risk management and strategic trade selection.
When to explore it
The Advanced Choppiness Indicator is most effective in markets with variable volatility where trend identification can be challenging. Traders should prioritize its signals during periods of potential trend transitions, using the indicator to confirm or validate other technical analysis tools and trading strategies.
It works particularly well in markets with clear directional movements and when combined with additional confirmation indicators. Traders should pay special attention to the histogram bars, CPMA angle, and choppiness thresholds to make more precise trading decisions across different timeframes and market conditions.
Keep exploring
What we’ve verified
Access, alerts and repainting behaviour have not been independently verified for this indicator. Check the creator’s current publication and settings.
General descriptions and classifications are recovered research. Verified details above identify the specific checks we have completed. Check the creator’s current publication for later changes.