ADX and DI
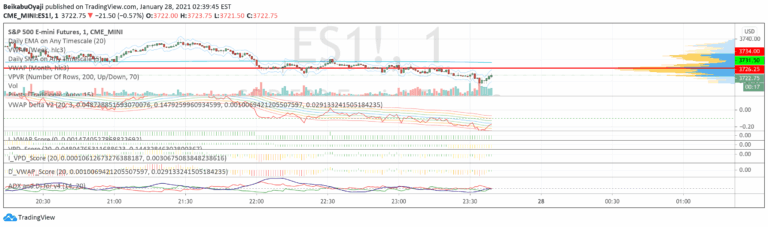
ADX measures trend strength and direction by analyzing price movement. It helps traders identify the presence and power of a trend, indicating whether a market is trending or ranging.
Explore 11,183 indicators. Filter beyond the obvious.
Discover the tools that fit the way you trade.
11,183 tools to explore
ADX measures trend strength and direction by analyzing price movement. It helps traders identify the presence and power of a trend, indicating whether a market is trending or ranging.
Advanced trading tool that detects divergences across multiple technical indicators, helping traders identify potential trend reversals and momentum shifts through comprehensive pivot point analysis.
Ichimoku Kinko Hyo is a comprehensive technical indicator that provides insights into trend direction, momentum, and potential support and resistance levels using multiple components.
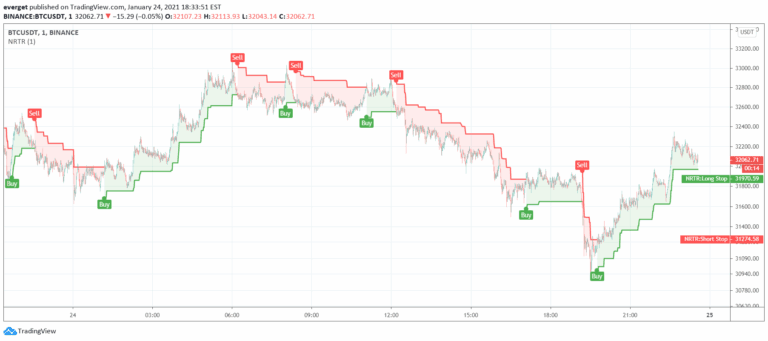
Nick Rypock Trend Reversal (NRTR) is a dynamic price channel indicator that tracks trend direction by measuring price extremes and percentage deviation from peak or bottom.
Renko Candles Overlay is a charting technique that transforms price action into uniform-sized bricks, offering a simplified visual representation of market trends and price movements.
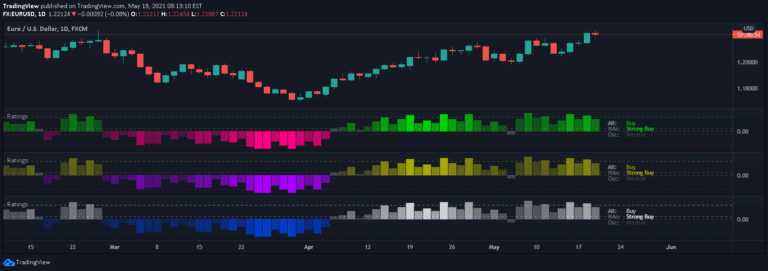
A comprehensive trading signal that aggregates 26 technical indicators into a single rating, evaluating market sentiment through moving averages and oscillators to provide actionable trading insights.
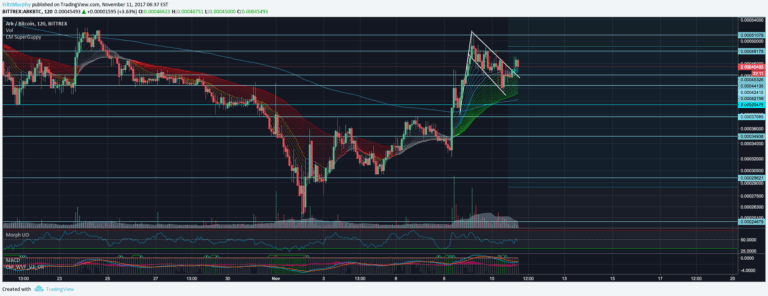
An enhanced Exponential Moving Average (EMA) script based on the Super Guppy format, designed to provide advanced trend analysis by utilizing multiple EMA lengths for comprehensive market insights.
A trading signal that combines trend bias, oscillator analysis, and divergence detection to help traders make more informed decisions about trend continuation, reversal, and potential profit-taking.
A multi-timeframe Fair Value Gap indicator that identifies market imbalances and potential price targets by highlighting gaps between price candles across different timeframes.
A sophisticated moving average screener that provides multiple signal generation methods across different moving average types, enabling flexible trend identification and trading strategy development.
Follow Line is a trend-following indicator that tracks price movements relative to Bollinger Bands, generating buy and sell signals based on price volatility and directional changes.
A comprehensive trading indicator combining Parabolic SAR, EMA 200, and MACD to generate precise buy and sell signals by analyzing market trends and momentum.
Likes, views, and comments are historical TradingView snapshots. They describe attention, not trading performance.