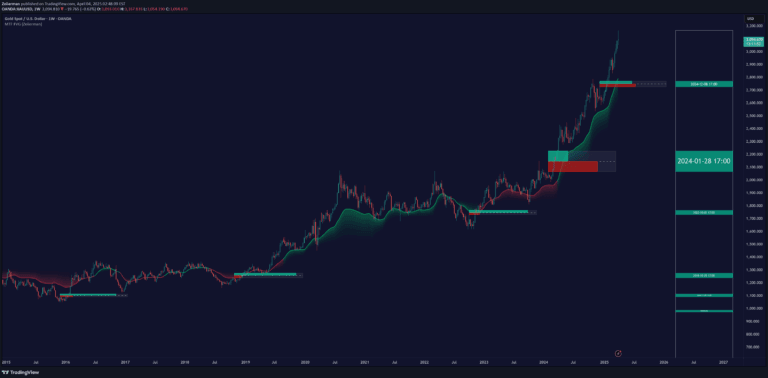
A multi-timeframe Fair Value Gap indicator that identifies market imbalances and potential price targets by highlighting gaps between price candles across different timeframes.
Explore complementary indicator rolesHow it works
The Fair Value Gap indicator analyzes price action across multiple timeframes to identify market imbalances. It creates visual gaps between price candles that represent potential trading targets. The indicator can display gaps from the current timeframe and a higher timeframe simultaneously.
Each gap is marked with a specific color and can include a midpoint fill line. The system tracks these gaps and can automatically delete them when they are filled, providing traders with dynamic visual cues about potential price movements and market structure
Why it may be useful
Fair Value Gaps help traders understand market dynamics by revealing hidden price imbalances. They provide clear visual targets that often get filled, offering potential entry and exit points. By showing gaps across different timeframes, traders can gain insights into broader market trends and local price movements.
These gaps represent areas where price has moved quickly, creating potential zones of interest for traders. Understanding these imbalances can improve trade decision-making and provide a structured approach to market analysis
When to explore it
Fair Value Gap indicators work best in markets with clear trending behavior and sufficient liquidity. They are most effective when used on major currency pairs, stock indices, and liquid commodities. Traders should apply this indicator during periods of consistent price movement, avoiding choppy or extremely range-bound markets.
It is particularly useful for swing and day traders looking to identify potential reversal or continuation zones. The multi-timeframe feature allows for a more comprehensive market analysis, helping traders align their strategies with broader market trends
Keep exploring
What we’ve verified
Access, alerts and repainting behaviour have not been independently verified for this indicator. Check the creator’s current publication and settings.
General descriptions and classifications are recovered research. Verified details above identify the specific checks we have completed. Check the creator’s current publication for later changes.