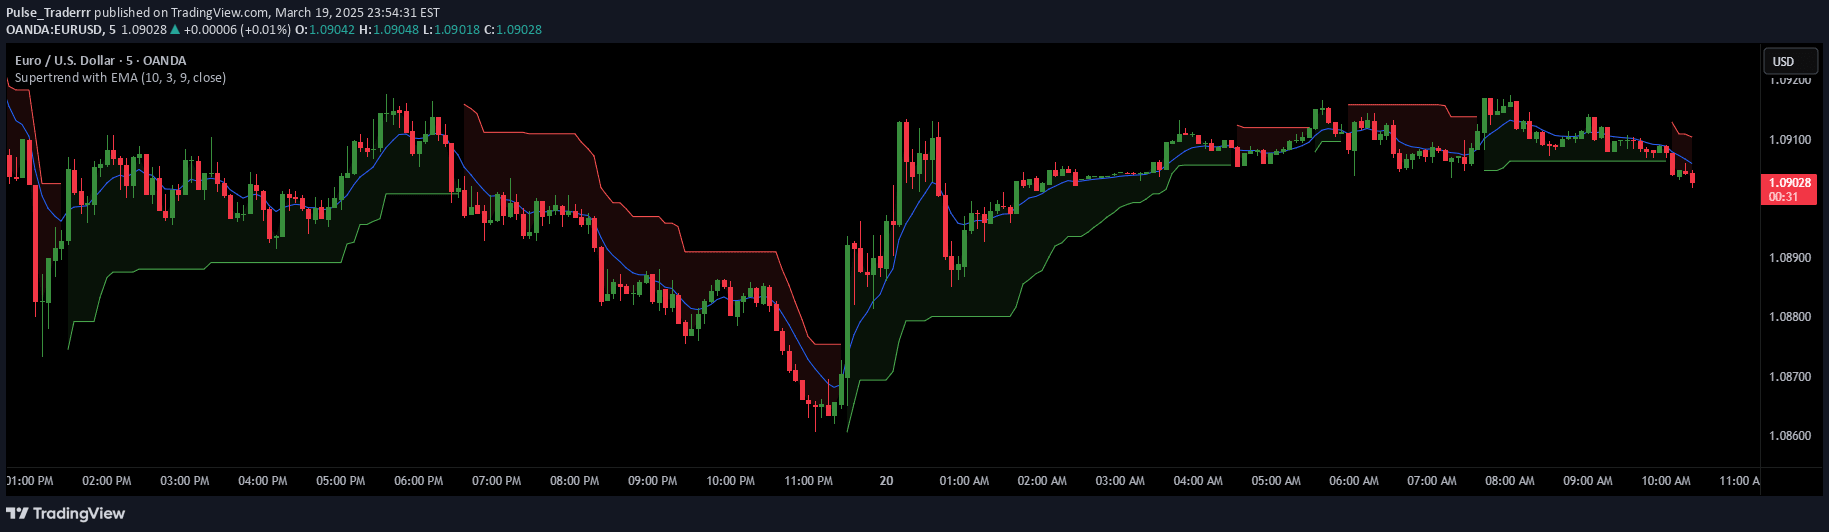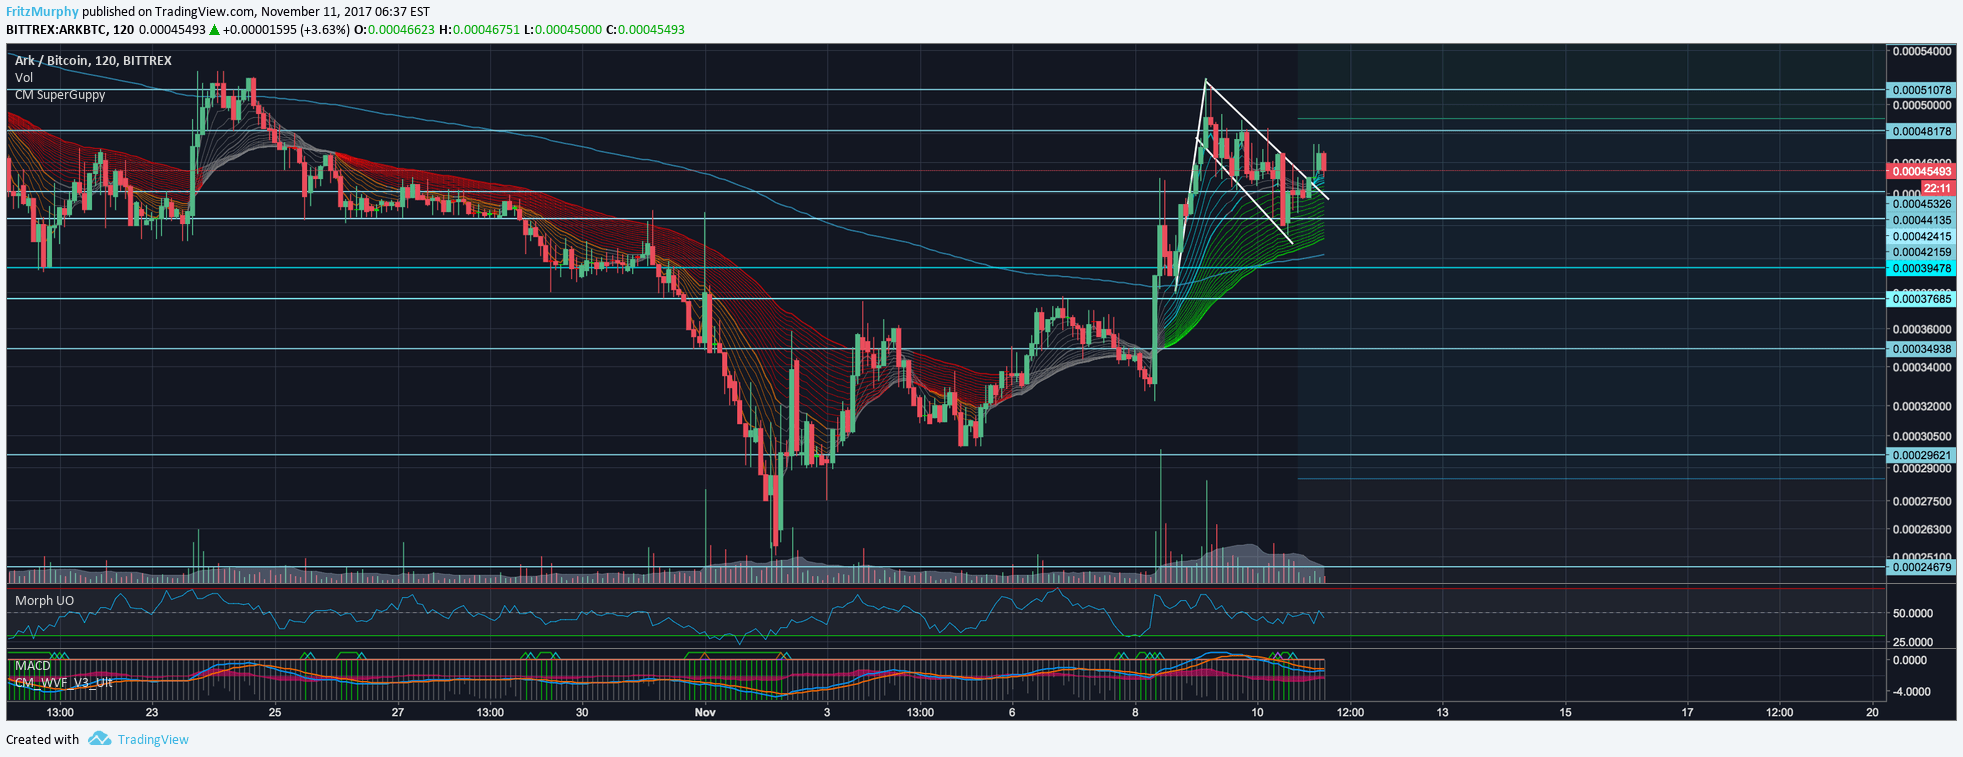
An enhanced Exponential Moving Average (EMA) script based on the Super Guppy format, designed to provide advanced trend analysis by utilizing multiple EMA lengths for comprehensive market insights.
Explore complementary indicator rolesHow it works
The Super Guppy EMA script utilizes multiple exponential moving averages with different time periods to analyze market trends. It calculates short-term and long-term EMAs, creating multiple lines that interact with each other. The script plots these EMAs using different colors and lengths, allowing traders to visualize trend strength and potential trend changes.
By comparing the positioning and interaction of these moving averages, traders can identify trend direction, momentum, and potential trend reversals. The script provides a visual representation of market dynamics through layered moving average lines
Why it may be useful
The Super Guppy EMA script is crucial for traders seeking comprehensive trend analysis. It provides a multi-dimensional view of market movements by using various EMA lengths. Traders can quickly assess trend strength, direction, and potential change points.
The script helps reduce market noise and offers a more nuanced understanding of price momentum. By displaying multiple EMAs simultaneously, it enables traders to make more informed decisions about entry and exit points. The visual representation makes complex trend information more accessible and interpretable
When to explore it
The Super Guppy EMA script works best in trending markets with clear directional movements. It is most effective in liquid markets like forex, stocks, and cryptocurrencies. Traders should use this indicator during periods of sustained price movement, avoiding choppy or highly volatile market conditions.
The script is particularly useful for swing and day traders looking to confirm trend strength and potential reversals. It performs optimally on timeframes ranging from 1-hour to daily charts. Traders should combine this indicator with other technical analysis tools for more robust trading strategies
Keep exploring
What we’ve verified
Access, alerts and repainting behaviour have not been independently verified for this indicator. Check the creator’s current publication and settings.
General descriptions and classifications are recovered research. Verified details above identify the specific checks we have completed. Check the creator’s current publication for later changes.