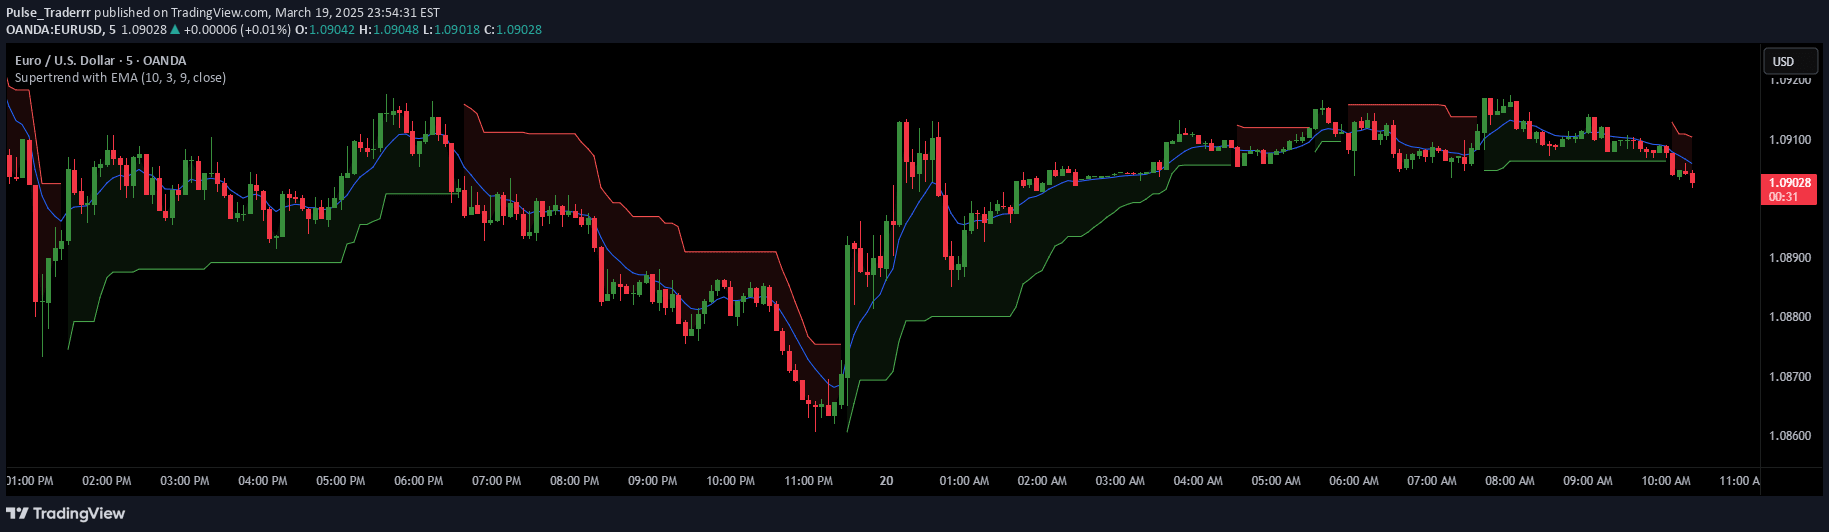
Supertrend EMA combines exponential moving averages with KNN machine learning to provide color-coded trend signals, offering dynamic breakout detection and trend identification.
Explore complementary indicator rolesHow it works
The Supertrend EMA indicator operates by utilizing two exponential moving averages with different lengths to create a dynamic trend visualization. The longer EMA provides a smooth trend direction, while the shorter EMA triggers faster color changes, indicating potential trend shifts.
The unique KNN breakout detection mechanism analyzes price action over a specified lookback period, identifying potential trend changes by comparing current price levels against recent highs and lows. When price surpasses a predefined threshold, the indicator changes color - green for potential uptrends and red for potential downtrends, offering traders a quick visual representation of market momentum.
Why it may be useful
The Supertrend EMA simplifies complex trend analysis by transforming intricate price movements into an intuitive, color-coded system that traders can quickly interpret. By integrating traditional moving average techniques with machine learning principles, the indicator provides a more responsive and nuanced view of market trends compared to standard moving average tools.
This innovative approach allows traders to rapidly identify potential trend shifts, reducing the cognitive load of interpreting multiple technical indicators. The visual color-coding mechanism enables traders to make faster, more informed decisions about market direction, potentially improving entry and exit timing across different trading strategies.
When to explore it
The Supertrend EMA is most effective in markets with clear directional movements, such as trending stocks, cryptocurrencies, or forex pairs experiencing sustained momentum. It performs exceptionally well in timeframes ranging from short-term scalping to longer-term swing trading, offering flexibility across different trading styles and asset classes.
Traders should consider using this indicator during periods of stable market conditions where trend persistence is more likely. It is particularly useful when combined with other confirmatory indicators or price action analysis, helping to filter out false signals and provide a more robust trading approach.
Keep exploring
What we’ve verified
Access, alerts and repainting behaviour have not been independently verified for this indicator. Check the creator’s current publication and settings.
General descriptions and classifications are recovered research. Verified details above identify the specific checks we have completed. Check the creator’s current publication for later changes.