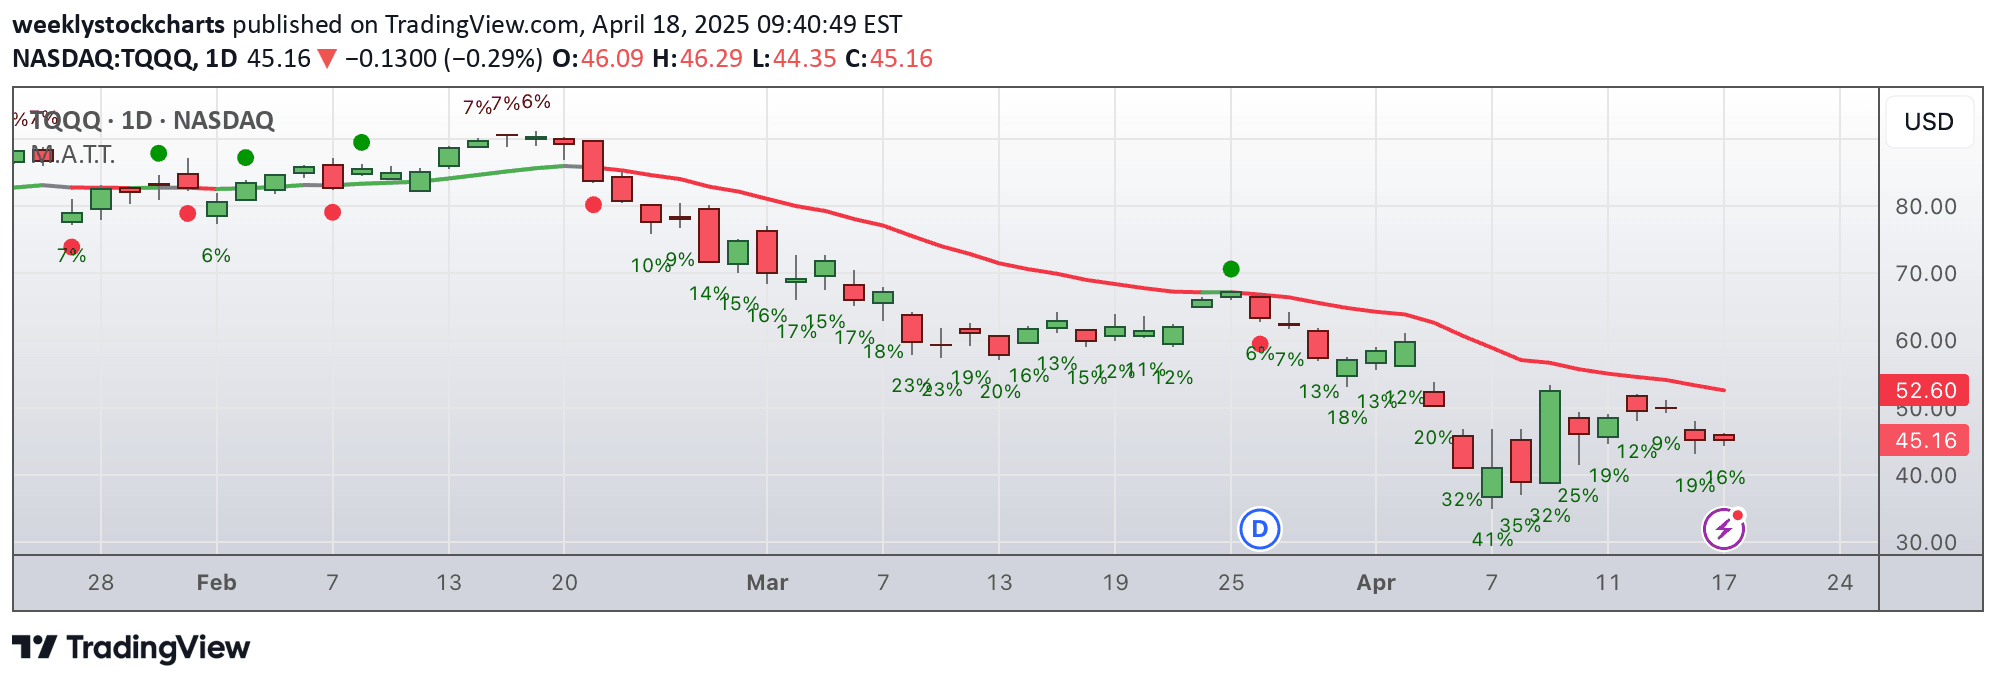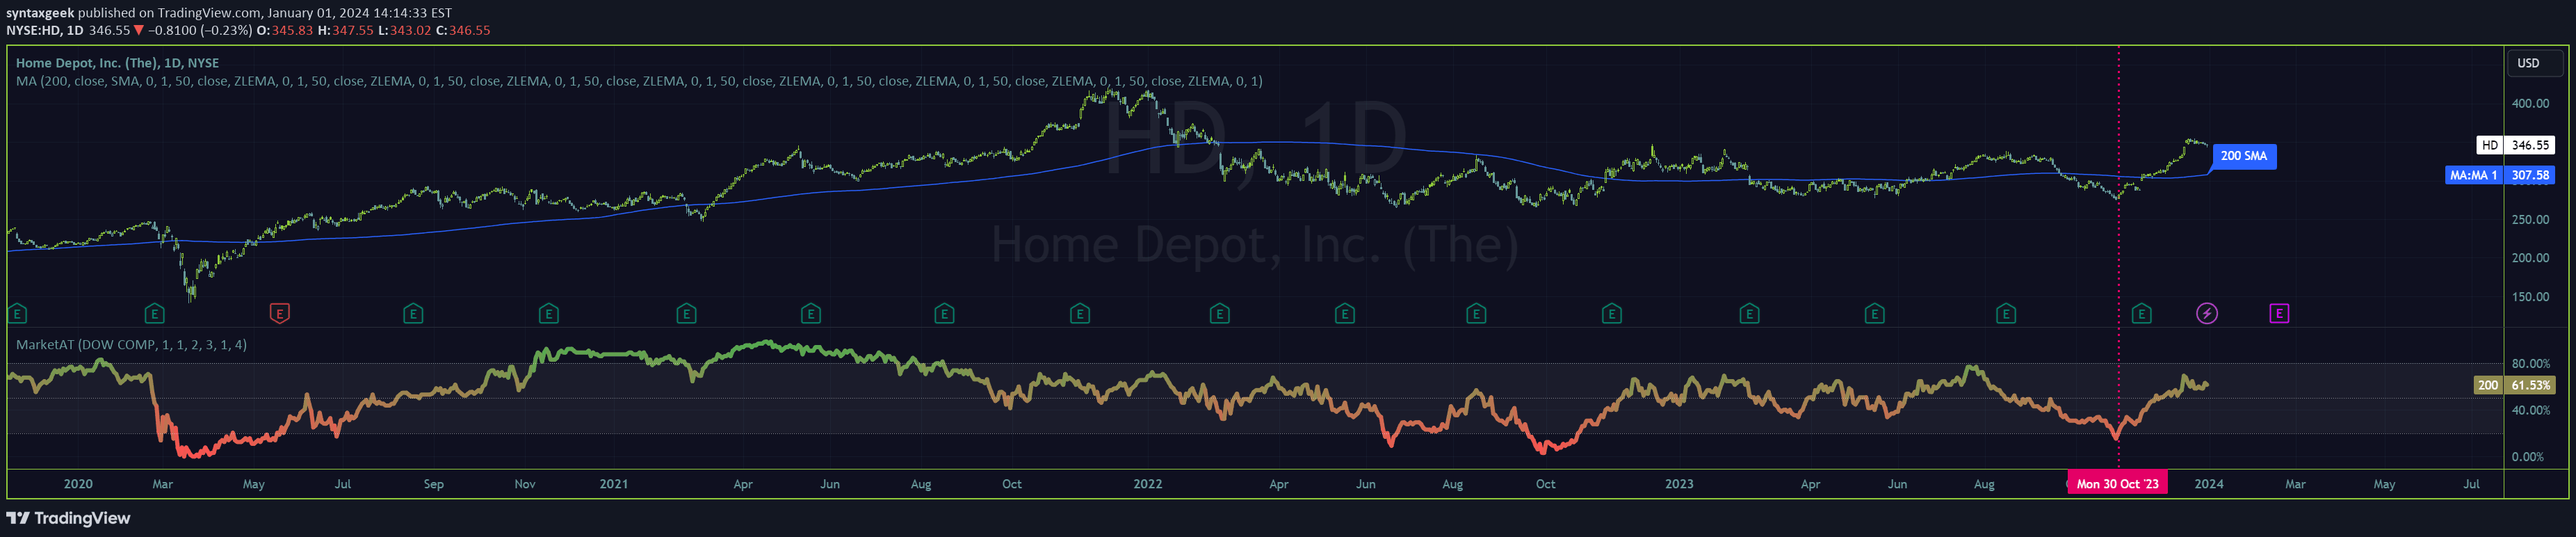
A comprehensive market breadth indicator that tracks stock index strength across multiple moving average timeframes, helping traders assess market sentiment and potential entry points.
Explore complementary indicator rolesHow it works
This indicator analyzes market strength by tracking simple moving averages across multiple timeframes including 5, 20, 50, 100, 150, and 200 periods. Traders can toggle different moving average combinations to create custom market strength assessments, with recommended classic combinations like 5 & 20 or 50 & 200.
The tool works specifically with major US market indexes and sectors, providing a comprehensive view of market internals and potential trend conditions. By examining how different moving averages interact, traders can quickly evaluate overall market momentum and potential trend continuation or reversal signals.
Why it may be useful
Market breadth indicators are crucial for understanding broader market sentiment beyond individual stock performance. This tool allows traders to quickly assess the underlying strength or weakness of major market indexes and sectors, providing a more holistic view of market conditions.
By offering insights across multiple moving average timeframes, traders can make more informed decisions about potential entry and exit points. The indicator helps identify whether a market is trending, consolidating, or potentially changing direction, which is essential for effective portfolio management and strategic trading.
When to explore it
This indicator is most effective when used on daily timeframes and above, providing a strategic overview of market conditions. It is particularly useful for swing traders looking to understand broader market trends and potential entry points for long or short positions.
Traders should be most attentive to this indicator when analyzing major market indexes and sectors, ensuring the data is representative of broader market movements. It's especially valuable when considering portfolio allocation, sector rotation strategies, and identifying potential trend continuation or reversal opportunities.
Keep exploring
What we’ve verified
Access, alerts and repainting behaviour have not been independently verified for this indicator. Check the creator’s current publication and settings.
General descriptions and classifications are recovered research. Verified details above identify the specific checks we have completed. Check the creator’s current publication for later changes.