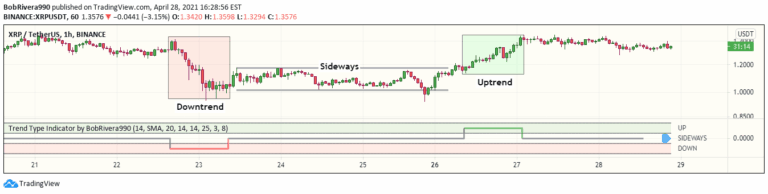
Trend Type Indicator by BobRivera990
A technical analysis signal that uses ATR and ADX to detect market trends, distinguishing between uptrend, downtrend, and sideways movements by analyzing price volatility and directional momentum.
Explore 11,183 indicators. Filter beyond the obvious.
Discover the tools that fit the way you trade.
11,183 tools to explore
A technical analysis signal that uses ATR and ADX to detect market trends, distinguishing between uptrend, downtrend, and sideways movements by analyzing price volatility and directional momentum.
A technical analysis tool that identifies price gaps between consecutive candlesticks, creating windows that signal potential trend continuation or reversal points.
A trading indicator that combines CCI/Momentum and RSI to identify potential market reversals by detecting extreme price points and momentum shifts.
A multi-timeframe trend analysis tool that evaluates market direction using exponential moving averages across different time intervals, providing a comprehensive view of trend strength.
ICT Turtle Soup is a trading strategy that exploits false breakouts in liquidity zones by identifying precise market structure shifts and potential reversal points across different markets.
A trading strategy focusing on identifying potential price continuation after 11:30 AM EST, using high/low of day zones and momentum indicators to signal trading opportunities.
The Three Drive pattern is a technical analysis formation that identifies potential trend reversals by analyzing a sequence of three consecutive price movements with decreasing momentum.
Price channels are technical analysis tools that use parallel trendlines to define dynamic support and resistance zones, helping traders identify trend direction and potential entry/exit points.
An advanced trading signal that combines RSI, divergence, and momentum oscillators to generate precise buy and sell entries with adaptive mean reversion and trend filtering mechanisms.
A script demonstrating time range backtesting techniques for trading strategies, enabling precise testing of entry and exit points within specific date ranges.
A novel Relative Strength indicator that compares an asset's performance against market indices like S&P 500, Dow Jones, and NASDAQ to provide comparative market insights.
A TradingView indicator that identifies potential breakout and breakdown opportunities by tracking the initial 30-minute range of a trading session, generating buy and sell signals based on price movement.
Likes, views, and comments are historical TradingView snapshots. They describe attention, not trading performance.