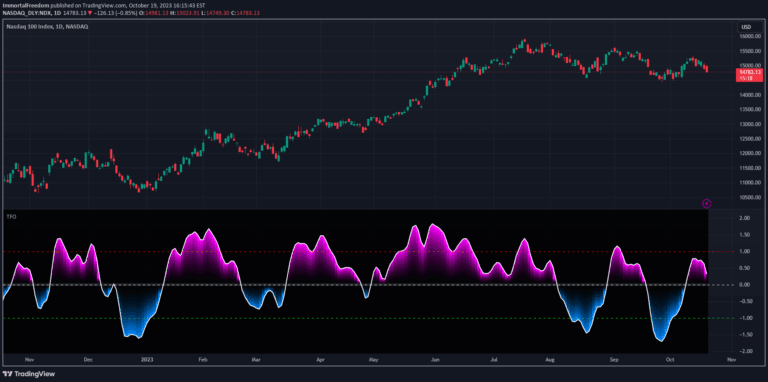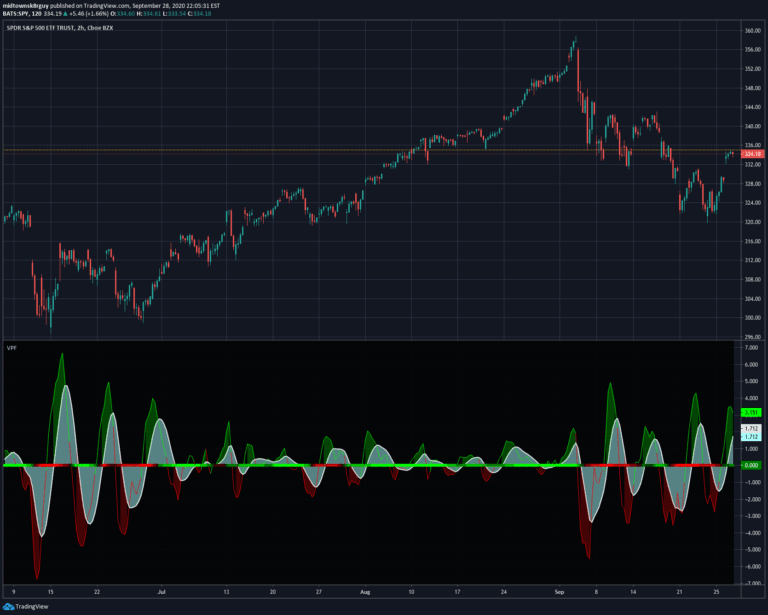
Voss Predictor (A Peek Into the Future) - Dr. John Ehlers
A multi-indicator trading tool that uses Ehlers' bandpass filter and Voss predictor to anticipate potential cyclic turning points in market price movements.
Explore 11,183 indicators. Filter beyond the obvious.
Discover the tools that fit the way you trade.
11,183 tools to explore
A multi-indicator trading tool that uses Ehlers' bandpass filter and Voss predictor to anticipate potential cyclic turning points in market price movements.
A novel trend oscillator developed by Dr. John Ehlers that provides near zero-lag averaging with consistent performance across multiple timeframes and candle durations.
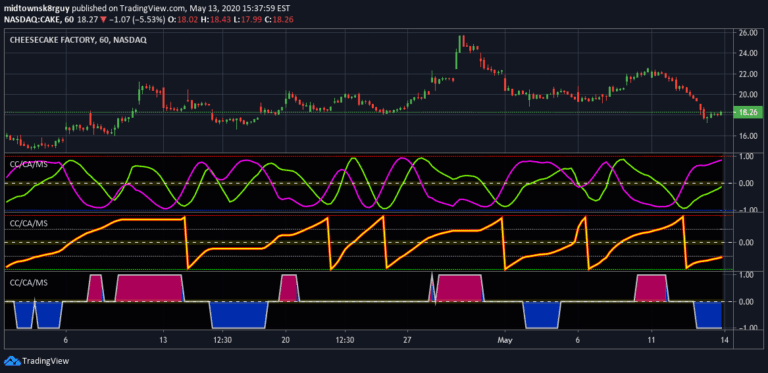
A multi-component trading indicator developed by Dr. John Ehlers that combines correlation cycle, correlation angle, and market state analysis to provide comprehensive market trend insights.
An improved McGinley Dynamic indicator that addresses computational limitations by implementing constraints to prevent extreme calculations and provide more stable trend analysis.
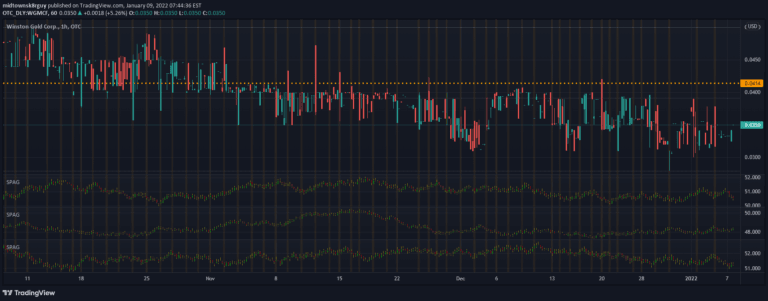
A novel Relative Strength indicator that compares an asset's performance against market indices like S&P 500, Dow Jones, and NASDAQ to provide comparative market insights.
The Reflex Oscillator is an advanced technical indicator designed to detect market reversals with minimal lag, utilizing Dr. John Ehlers' innovative zero-lag averaging technique across multiple timeframes.
An advanced cycle period detector that analyzes market data spectral estimates to identify dominant cycles and frequencies in price action, providing insights into market rhythms and potential trend movements.
A comprehensive suite of volatility estimators that analyze market price fluctuations using multiple advanced mathematical approaches to quantify market uncertainty and potential price movements.
A synthetic price action generator designed for developers to create and test trading indicators by producing randomized but realistic-looking price candles with customizable parameters.
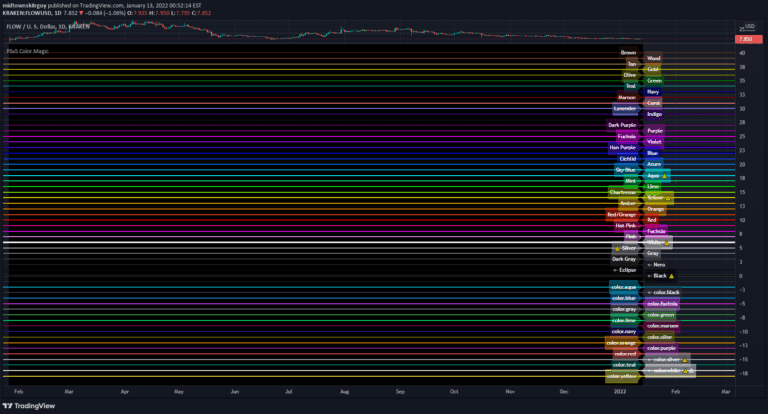
A Pine Script color visualization tool designed to enhance trading indicator development by leveraging advanced color manipulation techniques for improved data representation and visual analytics.
A mathematical approach to creating complex 3D data structures and arrays in Pine Script, enabling advanced data processing and analysis for trading strategies.
Advanced error function (ERF) exploration designed to provide sophisticated mathematical computations for probability analysis, statistical research, and complex scientific modeling across multiple disciplines.
Likes, views, and comments are historical TradingView snapshots. They describe attention, not trading performance.