
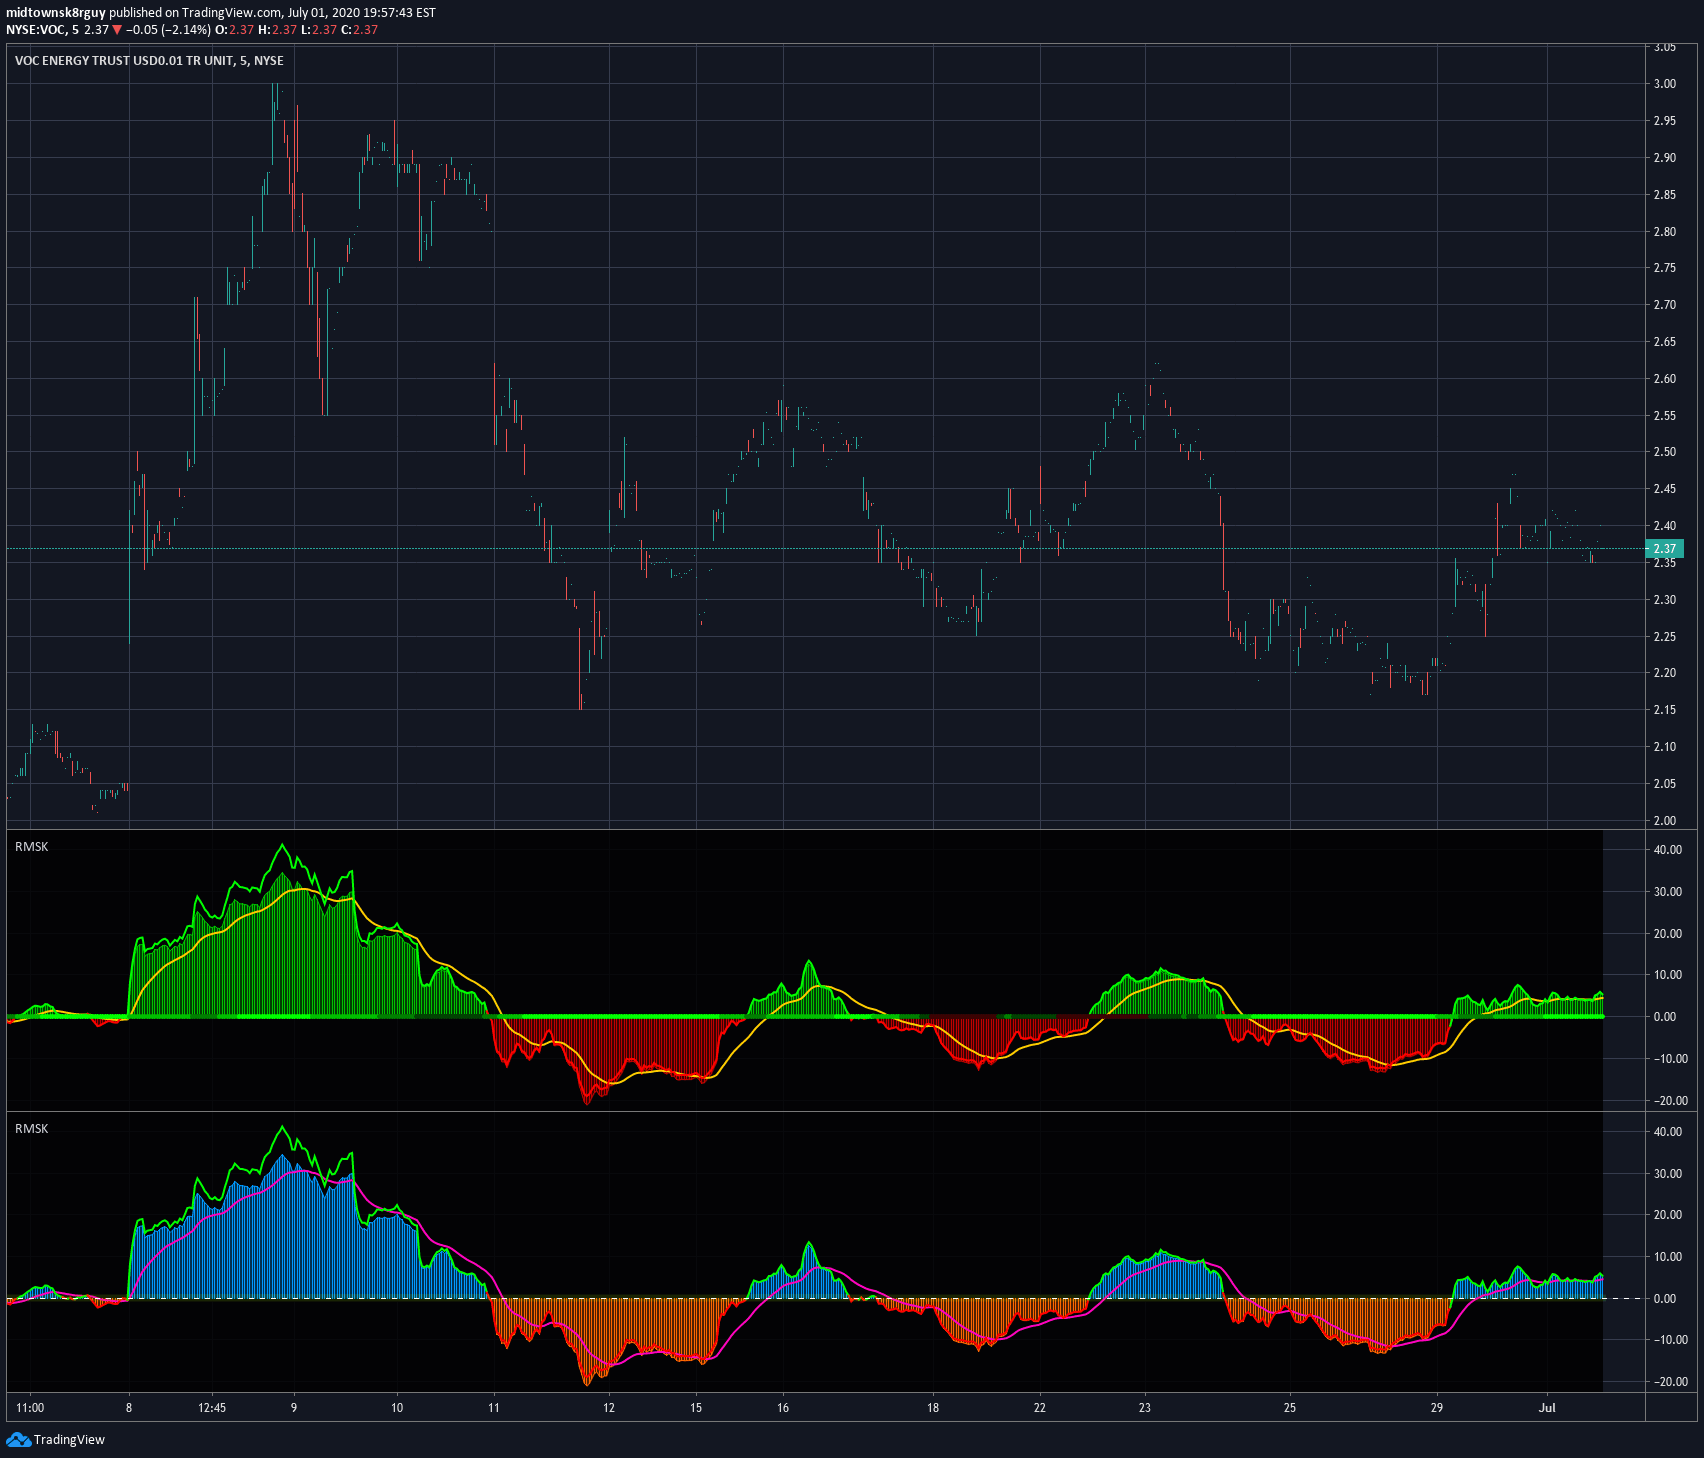
A novel Relative Strength indicator that compares an asset's performance against market indices like S&P 500, Dow Jones, and NASDAQ to provide comparative market insights.
Explore complementary indicator rolesHow it works
The Relative Strength (RSMK) indicator compares the performance of a specific asset against selected market indices using a comparative algorithmic approach. It calculates the relative strength by analyzing price movements and performance differentials between the asset and chosen benchmark indices.
The indicator leverages advanced Pine Script programming techniques to create a flexible and customizable analytical tool. Users can select different market indices for comparison, allowing for a dynamic and adaptable analysis. The algorithm processes price data to generate comparative strength metrics that reveal the asset's performance relative to broader market trends
Why it may be useful
Comparative relative strength analysis provides traders with critical insights into an asset's performance context within broader market movements. By comparing an individual asset against major market indices, traders can identify potential strengths, weaknesses, and comparative market dynamics.
This approach helps traders make more informed investment decisions by understanding how their chosen asset performs relative to benchmark indices. The indicator offers a nuanced perspective on market performance, enabling more strategic trading and investment strategies. Traders can quickly assess whether an asset is outperforming or underperforming the overall market
When to explore it
The Relative Strength (RSMK) indicator is most effective during periods of market transition or when evaluating asset performance across different market conditions. It works best for traders seeking comprehensive market analysis and comparative insights. Ideal for swing traders and day traders who want to understand an asset's relative strength against major market indices.
Particularly useful when analyzing stocks, ETFs, or other financial instruments with clear market correlations. Traders can utilize this indicator during market rotations, sector shifts, or when assessing potential investment opportunities across different market segments
Keep exploring
What we’ve verified
Access, alerts and repainting behaviour have not been independently verified for this indicator. Check the creator’s current publication and settings.
General descriptions and classifications are recovered research. Verified details above identify the specific checks we have completed. Check the creator’s current publication for later changes.





