The Congestion Index identifies market phases by measuring price changes relative to price range, helping traders distinguish between trending and range-bound markets.
Explore complementary indicator rolesHow it works
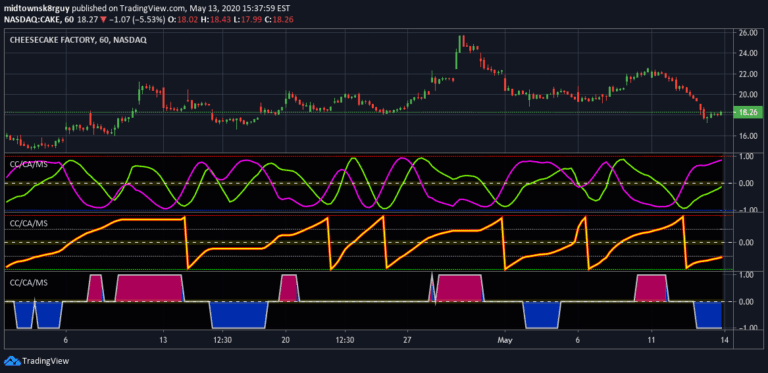
The Congestion Index calculates market character by dividing actual percentage price change over x days by the extreme price range. It uses the Rate of Change (ROC) of closing prices compared to the highest high and lowest low within a specified period.
When the index falls between +20 and -20, it indicates a congestion or sideways market. Crossing above +20 suggests a rising trend, while dropping below -20 indicates a potential downtrend. The indicator helps traders understand market dynamics by measuring price momentum against price volatility
Why it may be useful
The Congestion Index solves a critical trading challenge by identifying market phases accurately. Traditional trend-following indicators often fail during sideways markets, while oscillators struggle in trending conditions. This indicator provides a dynamic tool to switch between different trading strategies based on market behavior.
It helps traders avoid false signals and select appropriate indicators for current market conditions. By understanding whether a market is trending or range-bound, traders can make more informed decisions and reduce unnecessary trade entries
When to explore it
The Congestion Index works best in markets with clear periodic movements or during transition periods between trends. It is particularly useful for swing traders and day traders seeking to adapt their strategies to changing market conditions.
Traders should apply this indicator when traditional trend-following methods produce inconsistent results. It performs well across various financial instruments, including stocks, forex, and commodities. The indicator is most effective when combined with other technical analysis tools to confirm market phase transitions
Keep exploring
What we’ve verified
Access, alerts and repainting behaviour have not been independently verified for this indicator. Check the creator’s current publication and settings.
General descriptions and classifications are recovered research. Verified details above identify the specific checks we have completed. Check the creator’s current publication for later changes.