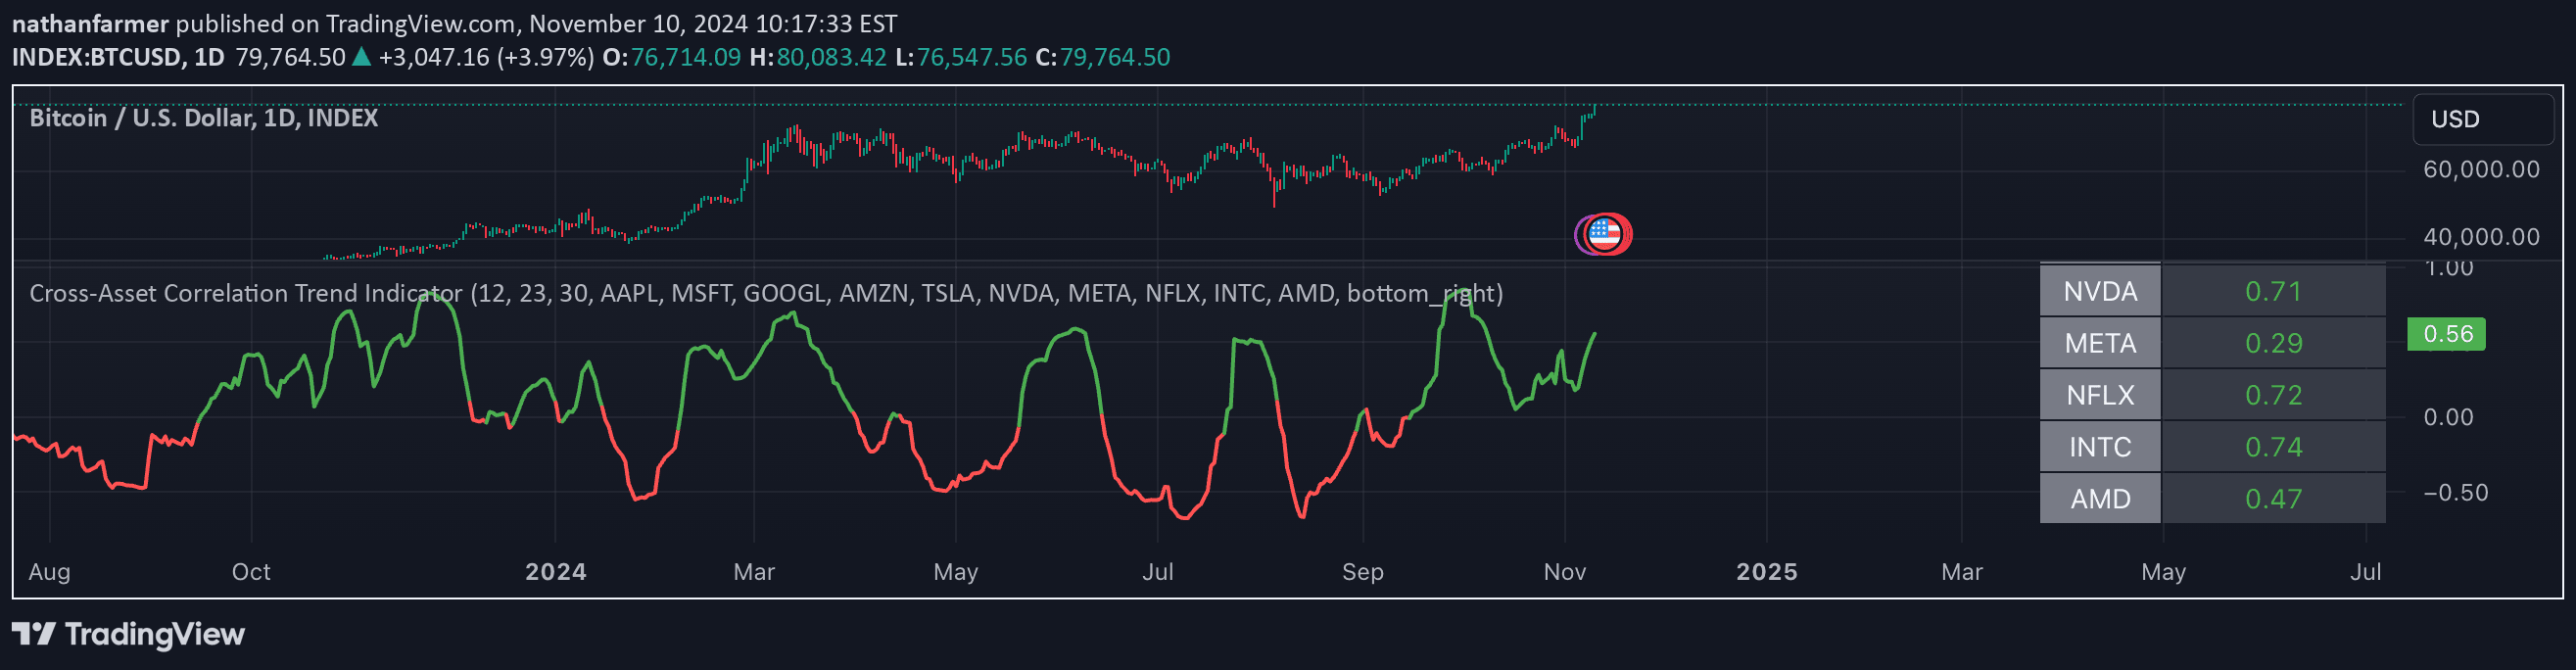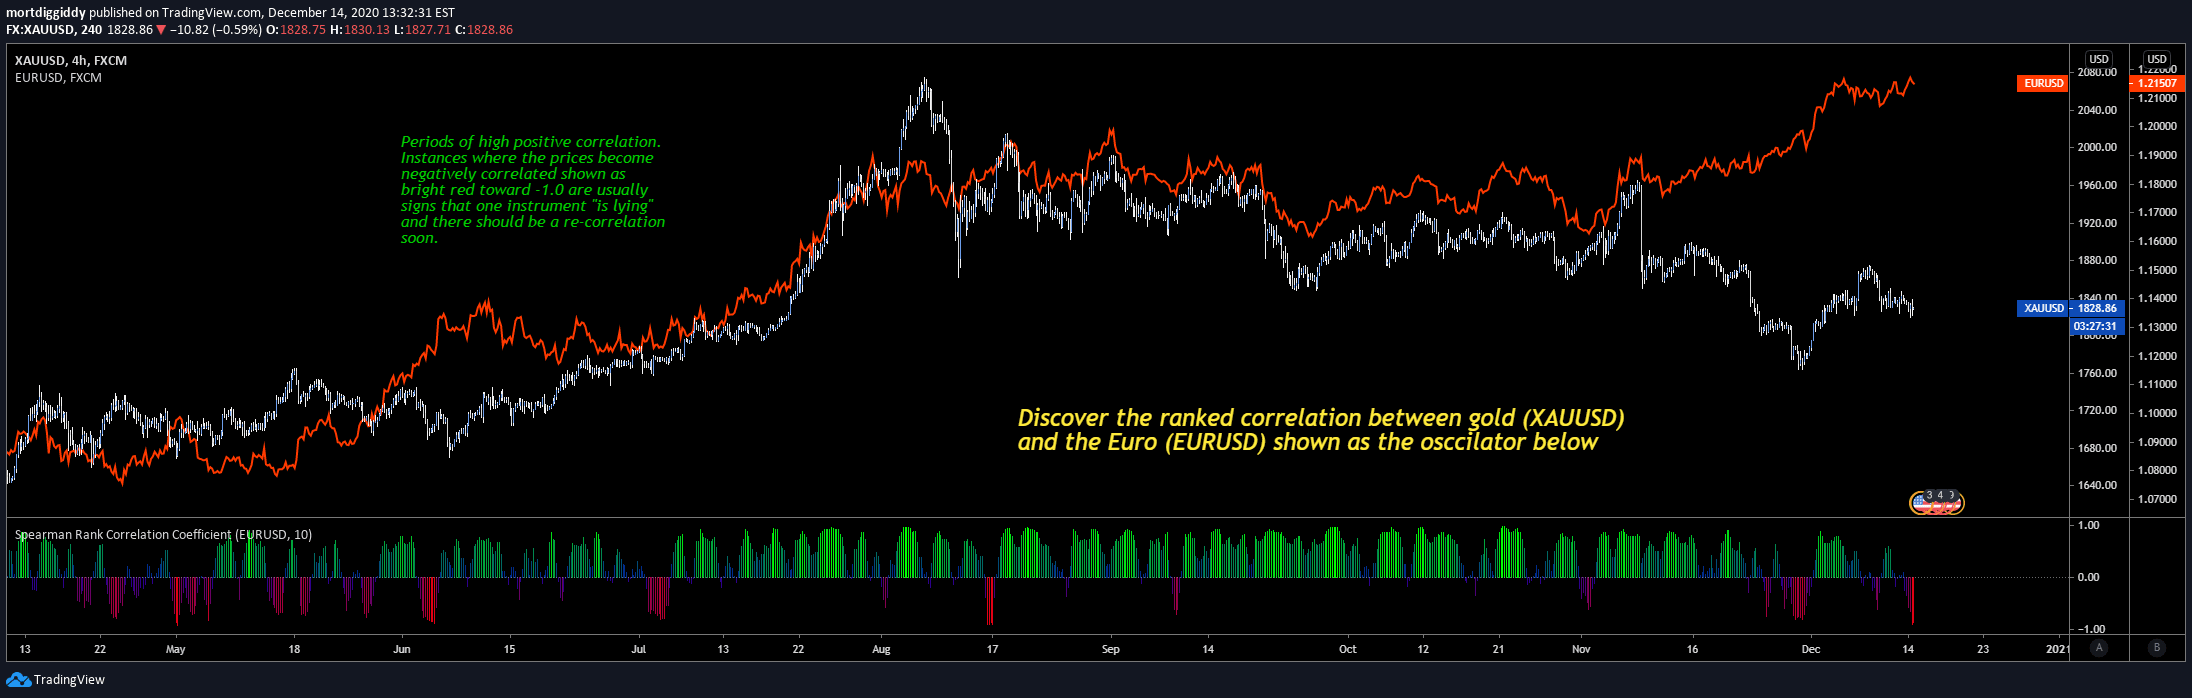
Spearman rank correlation coefficient measures the relationship between two variables by analyzing how they increase or decrease together, revealing potential market synchronization patterns.
Explore complementary indicator rolesHow it works
The Spearman rank correlation coefficient transforms raw data into ranked values, comparing how two variables move in relation to each other. By assigning ranks to each data point, the indicator eliminates the impact of extreme values and focuses on the overall relationship between variables.
It calculates the correlation by examining the differences between these ranks and comparing their covariance. The resulting value ranges from +1 to -1, representing perfect positive correlation, perfect negative correlation, or no correlation respectively. This method provides a robust way to understand variable relationships without assuming linear connections
Why it may be useful
The Spearman rank correlation coefficient offers traders a powerful tool for understanding complex market relationships beyond traditional linear measurements. It helps identify hidden connections between different financial instruments, sectors, or market variables that might not be apparent through standard correlation methods.
By revealing how variables move together, traders can develop more sophisticated trading strategies, manage portfolio diversification, and anticipate potential market movements. This nonparametric approach provides insights into market dynamics that standard parametric methods might overlook
When to explore it
The Spearman rank correlation coefficient is most effective when analyzing non-linear relationships between financial variables. It works best in markets with complex, interdependent interactions such as cryptocurrency, emerging markets, or sectors with high volatility.
Traders should use this indicator when examining relationships between different assets, comparing performance across multiple timeframes, or investigating potential lead-lag relationships. It is particularly useful for identifying correlations that deviate from traditional linear expectations, making it valuable for advanced market analysis
Keep exploring
What we’ve verified
Access, alerts and repainting behaviour have not been independently verified for this indicator. Check the creator’s current publication and settings.
General descriptions and classifications are recovered research. Verified details above identify the specific checks we have completed. Check the creator’s current publication for later changes.