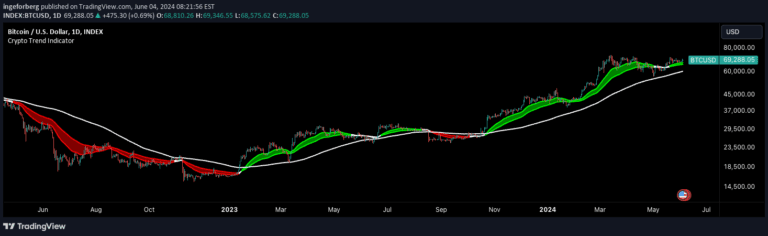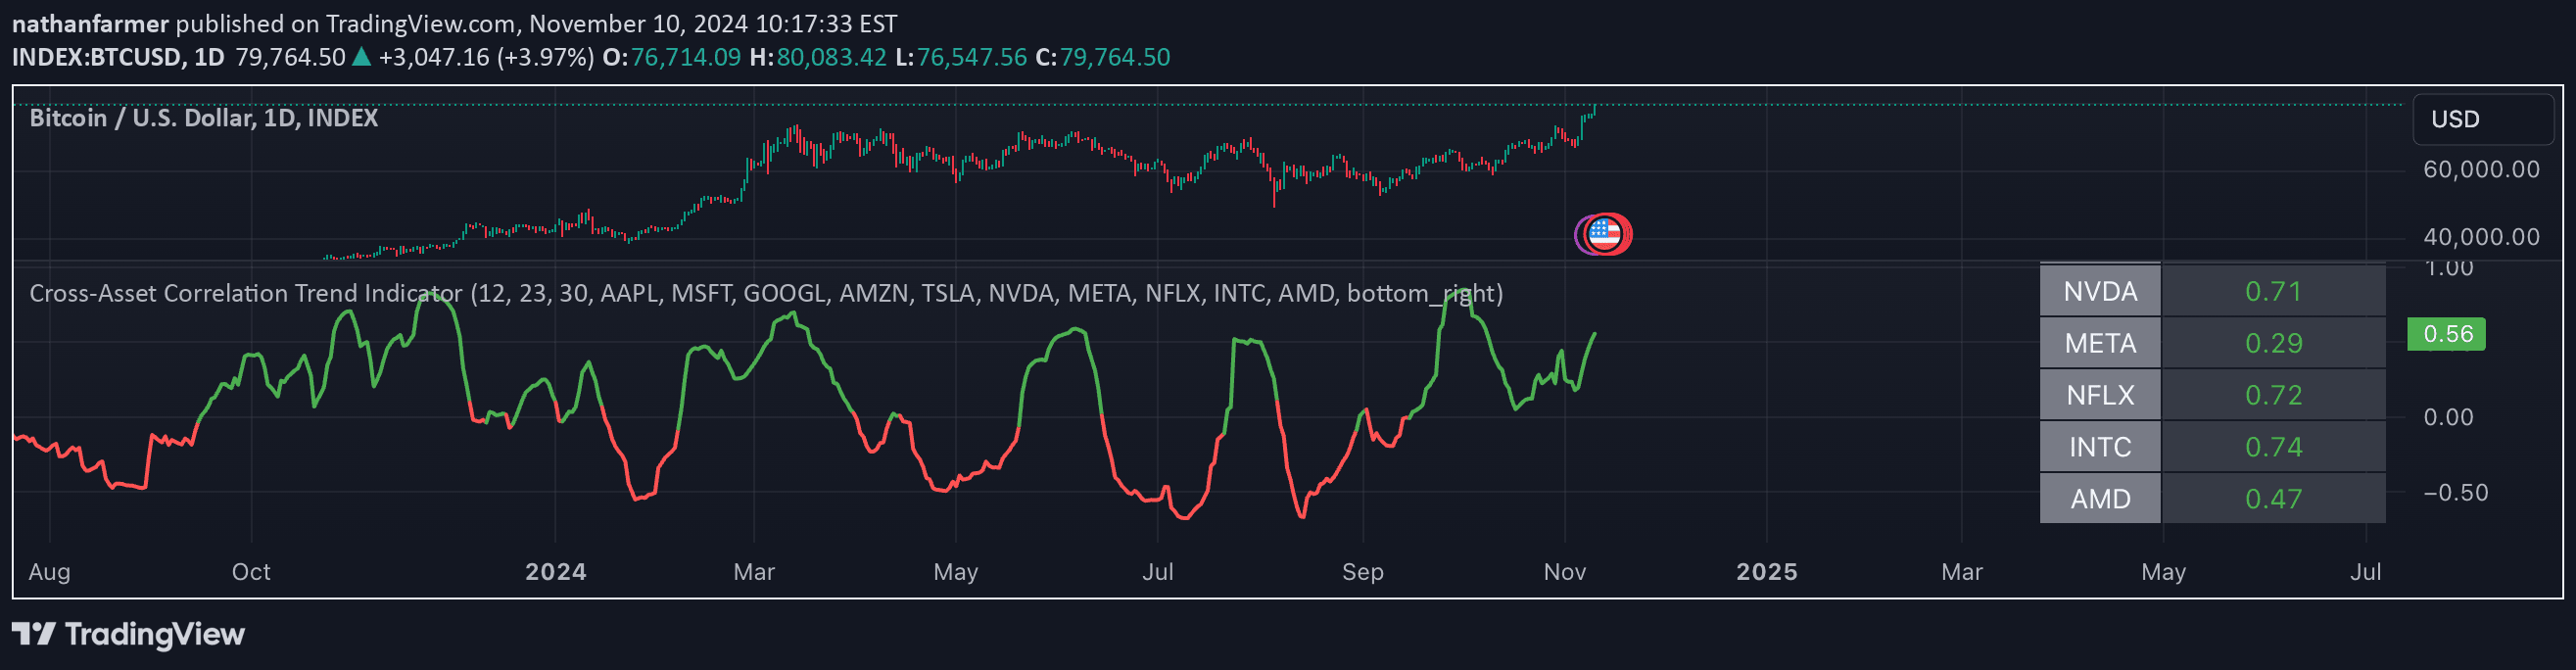
A cross-asset correlation trend indicator that analyzes multiple asset trends and their relationships to predict an average trend signal for the main charted asset.
Explore complementary indicator rolesHow it works
The indicator calculates trends for up to ten assets using exponential moving average (EMA) crossovers, comparing a shorter and longer EMA period. When the shorter EMA crosses above the longer EMA, the asset trend is considered positive, and when it crosses below, the trend is negative.
Each asset's trend is then weighted by its correlation coefficient with the charted asset's closing price. The final output is an average weighted trend signal that combines individual asset trends, providing a comprehensive view of potential market direction based on multiple correlated assets.
Why it may be useful
By analyzing correlations across multiple assets, traders can gain a more holistic view of market dynamics beyond a single asset's performance. This approach helps identify broader market trends and potential inter-asset relationships that might not be apparent when examining an asset in isolation.
The weighted correlation method provides a nuanced signal that considers not just trend direction, but also the strength of relationships between different market instruments. This can offer traders a more robust and sophisticated approach to trend analysis compared to traditional single-asset indicators.
When to explore it
This indicator is most effective in markets with established correlations between assets, such as stocks within the same sector, related commodities, or global market indices. It works best when traders have a solid understanding of inter-market relationships and are looking for a comprehensive trend assessment.
The signal is particularly useful for swing traders and day traders who want to understand broader market context and potential trend alignments. Traders should carefully select correlated assets and adjust input parameters to match their specific trading style and the characteristics of the markets they are analyzing.
Keep exploring
What we’ve verified
Access, alerts and repainting behaviour have not been independently verified for this indicator. Check the creator’s current publication and settings.
General descriptions and classifications are recovered research. Verified details above identify the specific checks we have completed. Check the creator’s current publication for later changes.