A trend-following indicator that combines exponential moving averages and correlation strength to identify high-confidence market trends across assets using multi-dimensional signal analysis.
Explore complementary indicator rolesHow it works
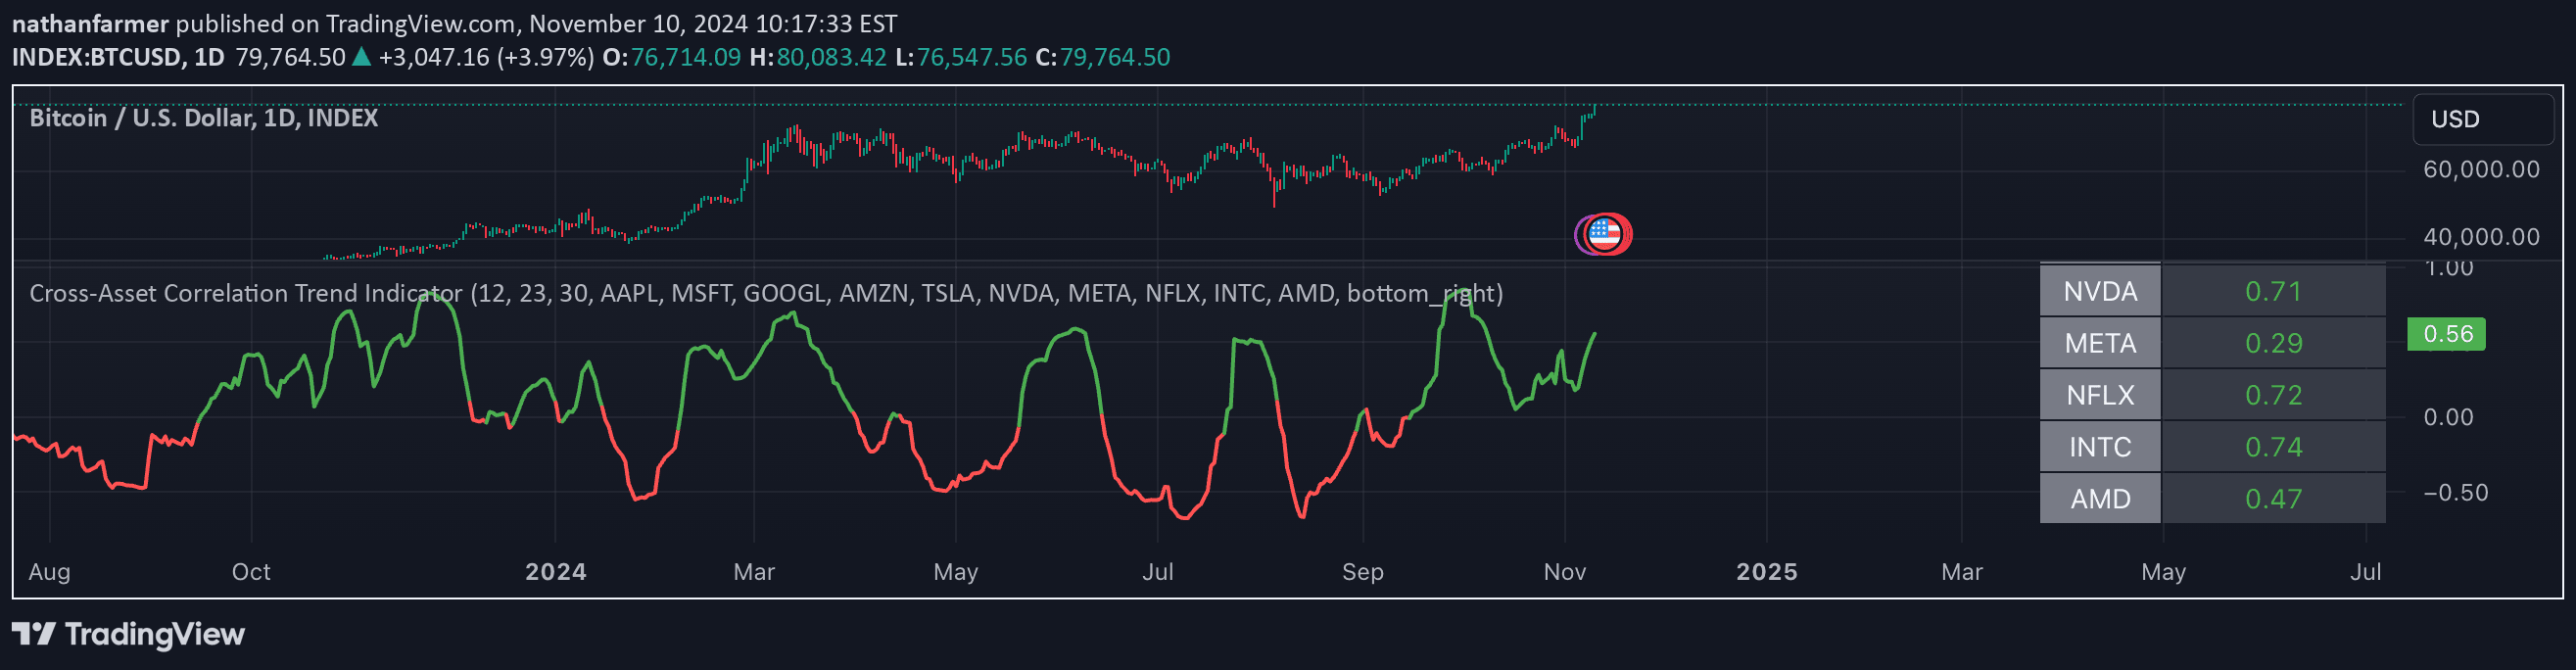
The Correlation Confluence Trend Indicator operates by first calculating fast and slow exponential moving averages (EMAs) for both the primary asset and a benchmark asset. It then evaluates the statistical correlation between these two assets, determining the strength of their relationship using mean and standard deviation calculations.
By comparing the trend directions of both assets and their correlation strength, the indicator generates nuanced trend signals. These signals are color-coded to represent different market conditions, such as strong or weak correlations between bullish and bearish trends, providing traders with a comprehensive view of potential market movements.
Why it may be useful
This indicator matters because it goes beyond traditional trend analysis by incorporating inter-asset correlation, which helps reduce false signals and improve trading confidence. By considering the relationship between an asset and its benchmark, traders can gain deeper insights into market dynamics and potential trend alignments.
The multi-dimensional approach allows traders to understand not just the trend of a single asset, but how it moves in context with broader market conditions. This can lead to more informed trading decisions and a more sophisticated understanding of market behavior.
When to explore it
The Correlation Confluence Trend Indicator is most effective in trending markets where assets show clear directional movements and meaningful correlations. It works best when used across different timeframes, particularly for day trading and swing trading strategies that aim to capture sustained price movements.
Traders should apply this indicator when they want to confirm trend strength, validate potential trade entries, and understand the relationship between an asset and its benchmark. It is particularly useful in markets with strong sector or index correlations, such as technology stocks relative to the NASDAQ or individual stocks compared to the S&P 500.
Keep exploring
What we’ve verified
Access, alerts and repainting behaviour have not been independently verified for this indicator. Check the creator’s current publication and settings.
General descriptions and classifications are recovered research. Verified details above identify the specific checks we have completed. Check the creator’s current publication for later changes.