Trendline Pivots [QuantVue]
Trendline Pivot Indicator automatically draws and recognizes dynamic trend lines connecting pivot highs and lows, providing visual support and resistance reference points on price charts.
Explore 11,183 indicators. Filter beyond the obvious.
Discover the tools that fit the way you trade.
11,183 tools to explore
Trendline Pivot Indicator automatically draws and recognizes dynamic trend lines connecting pivot highs and lows, providing visual support and resistance reference points on price charts.
A dynamic trend-tracking indicator that identifies major trend shifts, maps price impulses, and quantifies trend strength through adaptive volatility envelopes and real-time percentage calculations.
The Trend Oscillator is an indicator that analyzes price action by categorizing market trends into four distinct states, helping traders understand trend direction and momentum.
A normalized Kaufman Adaptive Moving Average (KAMA) oscillator that measures price efficiency and adapts to market conditions by transforming KAMA into a more dynamic indicator.
A trend change detector oscillator that helps identify market direction, potential reversals, and fair value using price and volume inputs.
Multi-timeframe SuperTrend indicator that visualizes trend dynamics across eight different timeframes, offering comprehensive trend analysis and confluence insights.
An adaptive moving average indicator that determines trend direction by calculating the absolute difference between current and past closing prices, providing dynamic trading signals.
A trend indicator using linear regression to plot short-term and long-term trend histograms, helping traders identify market direction and momentum across different timeframes.
A multi-timeframe Supertrend indicator that analyzes market trends by combining Supertrend calculations across different timeframes, providing comprehensive trend direction and potential trading signals.
An adaptive moving average indicator that dynamically adjusts to market conditions, using Laplace transformation and MESA techniques to identify and track market trends effectively.
SuperThree is a color-coded trend indicator that identifies market trends and momentum shifts, providing visual cues for potential trading opportunities across different market conditions.
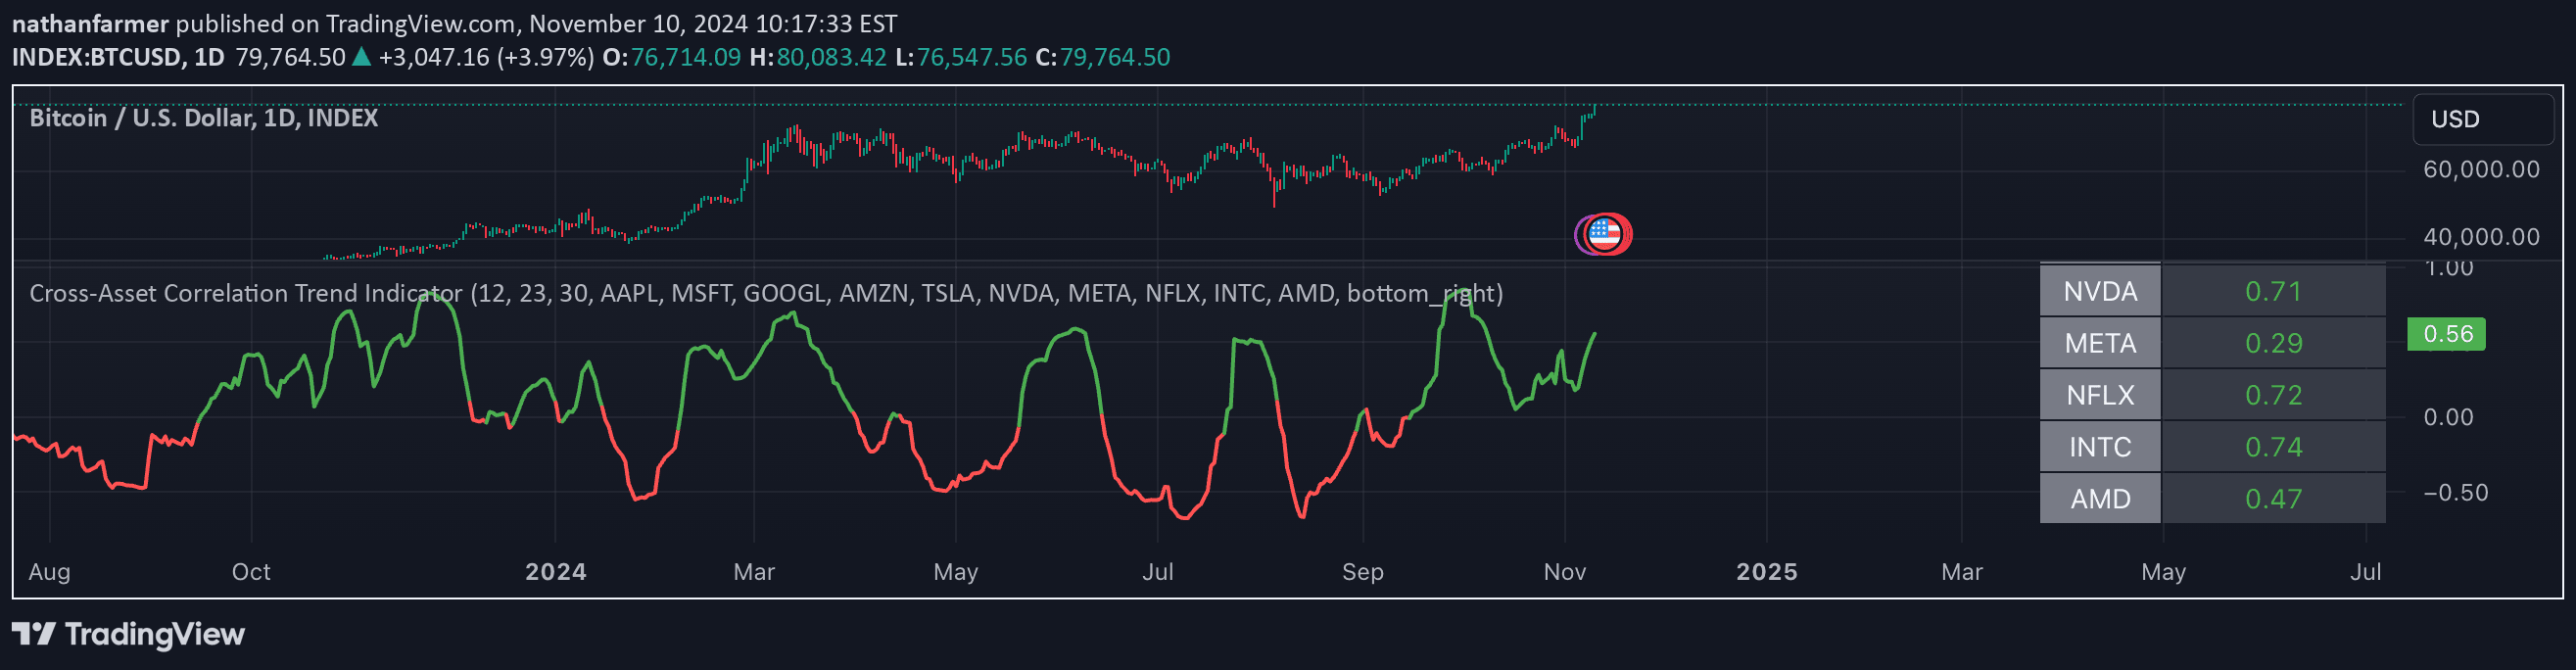
A cross-asset correlation trend indicator that analyzes multiple asset trends and their relationships to predict an average trend signal for the main charted asset.
Likes, views, and comments are historical TradingView snapshots. They describe attention, not trading performance.