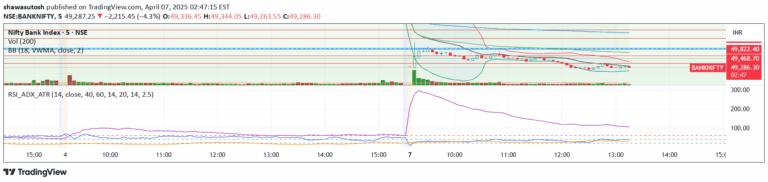
A trend indicator using linear regression to plot short-term and long-term trend histograms, helping traders identify market direction and momentum across different timeframes.
Explore complementary indicator rolesHow it works
The indicator calculates trend direction using linear regression, creating two distinct histogram representations. The colored histograms showcase the short-term trend dynamics, while the gray histogram illustrates the long-term trend trajectory. By plotting these histograms, traders can visually interpret market momentum and directional changes.
The calculation involves adjustable length parameters that determine the sensitivity of both short-term and long-term trend analysis. As the short-term length parameter changes, it proportionally influences the long-term trend calculation, providing a flexible and adaptive trend measurement tool.
Why it may be useful
Trend indicators are crucial for understanding market direction and potential future price movements. By providing a clear visual representation of both short-term and long-term trends, this indicator helps traders make more informed decisions about entry and exit points. It reduces emotional trading by offering an objective view of market momentum.
The dual-histogram approach allows traders to simultaneously assess different trend timeframes, providing a comprehensive market perspective. This helps traders align their strategies with the prevailing market conditions and identify potential trend reversals or continuations more effectively.
When to explore it
This trend indicator is most effective in markets with clear directional movements, such as trending stocks, forex pairs, or commodities. Traders can use it to confirm trend strength and potential reversal points across various timeframes, from scalping to swing trading. It works particularly well when combined with other technical analysis tools.
The indicator is especially useful during periods of market volatility, helping traders distinguish between temporary price fluctuations and genuine trend changes. By adjusting the length parameters, traders can customize the indicator to suit different market conditions and personal trading styles.
Keep exploring
What we’ve verified
Access, alerts and repainting behaviour have not been independently verified for this indicator. Check the creator’s current publication and settings.
General descriptions and classifications are recovered research. Verified details above identify the specific checks we have completed. Check the creator’s current publication for later changes.