Linear Regression Channel
A Linear Regression Channel indicator that tracks price trends, identifies channel breakouts, and analyzes momentum direction using dynamic visual signals and customizable settings.
Explore 11,183 indicators. Filter beyond the obvious.
Discover the tools that fit the way you trade.
11,183 tools to explore
A Linear Regression Channel indicator that tracks price trends, identifies channel breakouts, and analyzes momentum direction using dynamic visual signals and customizable settings.
Periodic Linear Regressions (PLR) calculates linear trend lines over customizable periods, helping traders identify underlying price trends and potential support/resistance zones.
An AI-powered moving average indicator using KNN algorithm to analyze price data, providing dynamic trend recognition and market classification through intelligent pattern interpretation.
A sophisticated trend detection tool using Gaussian filtering and linear regression to identify market trends, minimize noise, and provide clear trading signals with dynamic volume insights.
The Half Trend Regression indicator uses linear regression and ATR-based channels to detect market trends and potential reversals with dynamic trend lines and color-coded signals.
Linear Regression Intensity is an advanced trend analysis tool that measures market trend strength using linear regression, offering dynamic color-coded insights into bullish, bearish, and neutral market conditions.
A technical indicator that measures market volatility and momentum to help traders identify optimal trading periods and filter out false signals across different market conditions.
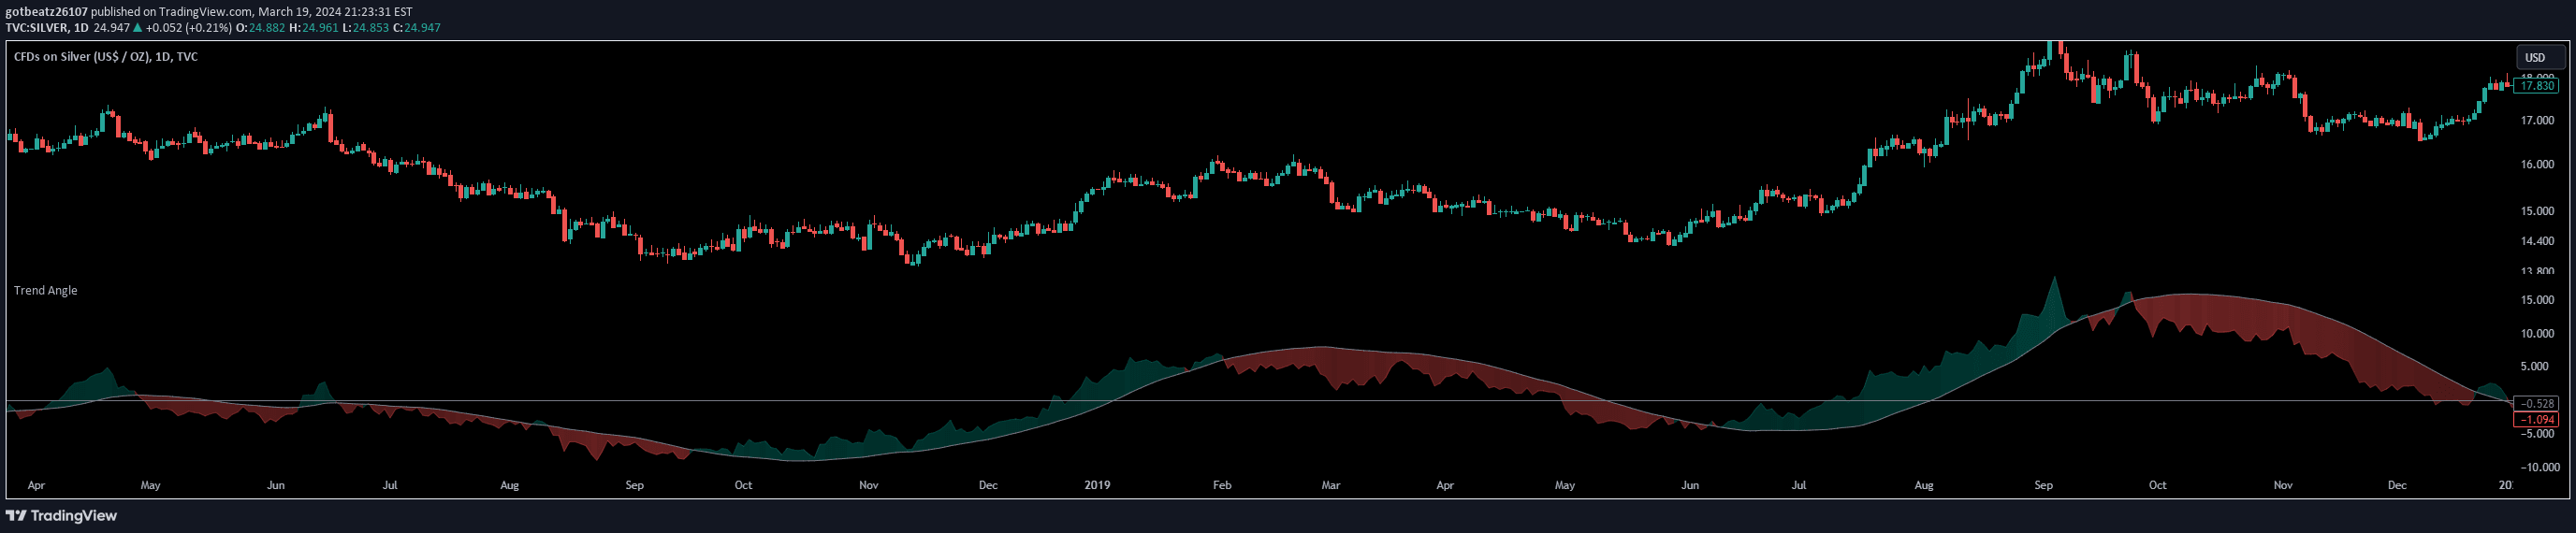
Trend Angle calculates the inclination of price movements over a specified timeframe, providing traders with a quantitative method to assess market directionality and momentum.
LRI Momentum Cycles is an advanced trading indicator that identifies market momentum shifts using trend normalization and linear regression analysis for precise trend detection.
A linear regression indicator that calculates average price deviation and visualizes trend direction through color-coded lines and dispersion markers.
A trend indicator that uses linear regression to color candles and plot an average line, helping traders identify market direction and potential support/resistance levels.
A modified linear regression channel using a 200-period length, providing trend direction and price range analysis with customizable visual settings.
Likes, views, and comments are historical TradingView snapshots. They describe attention, not trading performance.