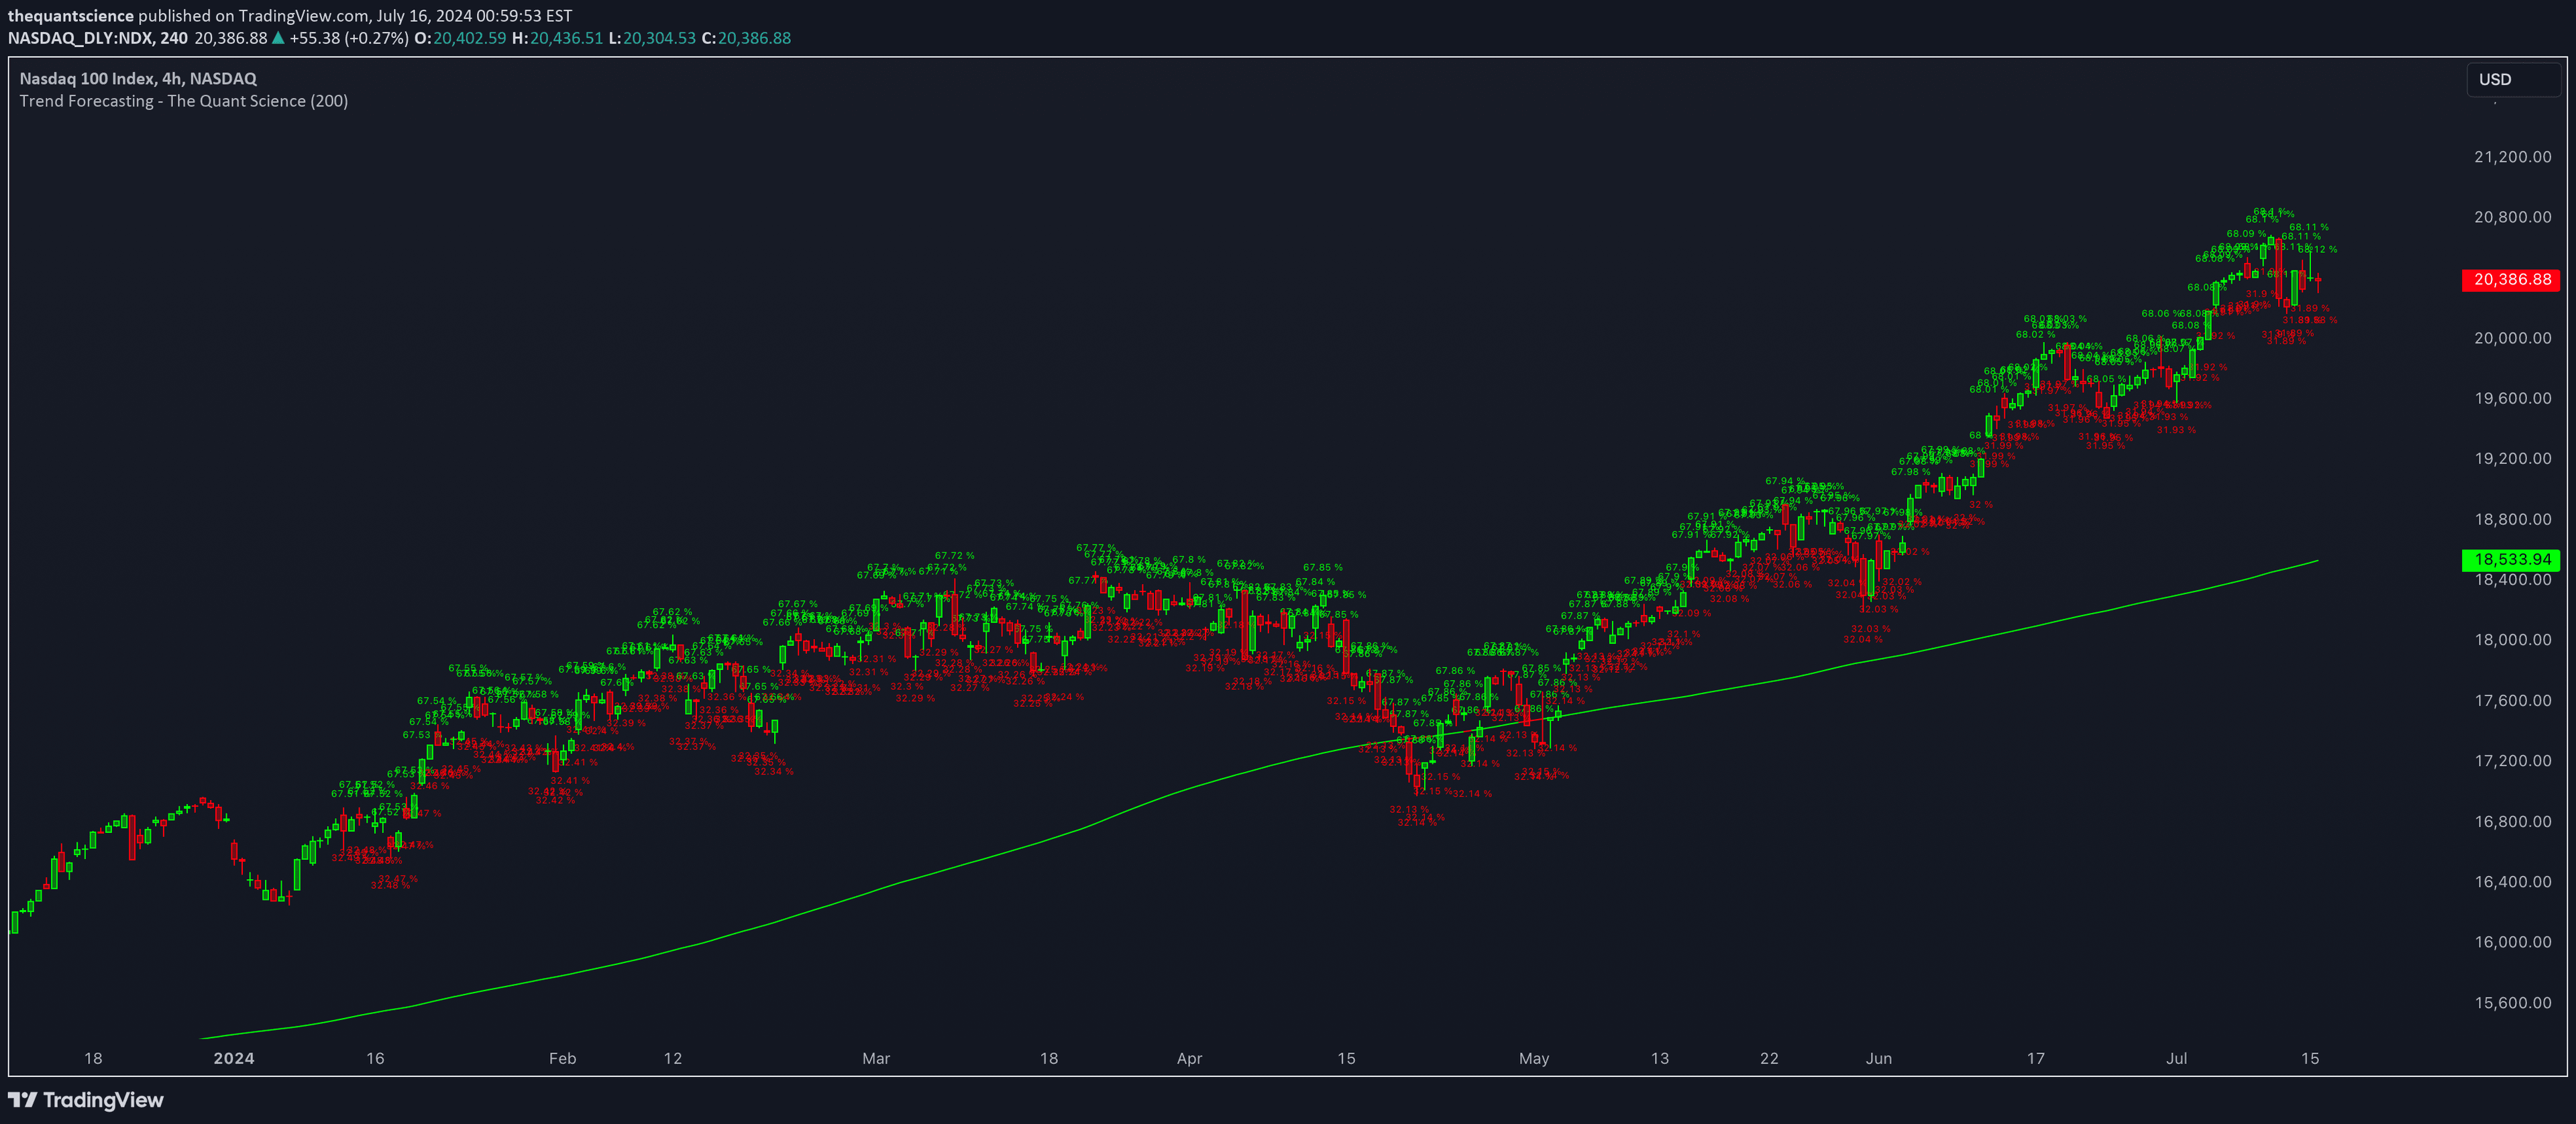
A linear regression indicator that calculates average price deviation and visualizes trend direction through color-coded lines and dispersion markers.
Explore complementary indicator rolesHow it works
The linear regression indicator calculates a best-fit line through price data, representing the overall trend direction of an asset. It measures the average deviation of prices from this regression line, creating visual markers that highlight price dispersions around the central trend.
By plotting the regression line in different colors based on price position, traders can quickly identify bullish and bearish market conditions. Green indicates prices above the regression line, suggesting upward momentum, while red indicates prices below the line, signaling potential downward pressure.
Why it may be useful
Linear regression helps traders understand underlying price trends by smoothing out short-term market noise and providing a statistical representation of price movement. It offers a more objective view of market direction compared to subjective visual trend analysis, allowing traders to make more informed decisions.
By highlighting price dispersions and trend directions, this indicator helps traders identify potential entry and exit points, assess market momentum, and gauge the strength of current price trends across different timeframes.
When to explore it
The linear regression indicator is most effective in markets with clear directional movement, such as trending stocks, currencies, or commodities. It works best when applied to timeframes that capture meaningful price action, from short-term intraday charts to longer-term weekly or monthly analyses.
Traders should use this indicator in conjunction with other technical analysis tools to confirm signals and validate potential trade opportunities. It is particularly useful during periods of sustained trend development and can help identify potential trend reversals or continuations.
Keep exploring
What we’ve verified
Access, alerts and repainting behaviour have not been independently verified for this indicator. Check the creator’s current publication and settings.
General descriptions and classifications are recovered research. Verified details above identify the specific checks we have completed. Check the creator’s current publication for later changes.