Global Liquidity Index
Global Liquidity Index tracks worldwide central bank balance sheets, providing a comprehensive view of global monetary conditions and potential market trends through consolidated financial data.
Explore 11,183 indicators. Filter beyond the obvious.
Discover the tools that fit the way you trade.
11,183 tools to explore
Global Liquidity Index tracks worldwide central bank balance sheets, providing a comprehensive view of global monetary conditions and potential market trends through consolidated financial data.
An experimental trading signal applying the Logistic Map Equation to popular indicators like Awesome Oscillator, ROC, RSI, and Stochastic to generate unique market insights through iterative mathematical calculations.
K-means clustering algorithm identifies potential support and resistance levels by grouping similar price data points, offering traders insights into market behavior and potential price reversals.
FRAMA Channel is a dynamic trend-following indicator that adapts to market conditions, creating an adaptive channel around price to identify trend changes and market momentum.
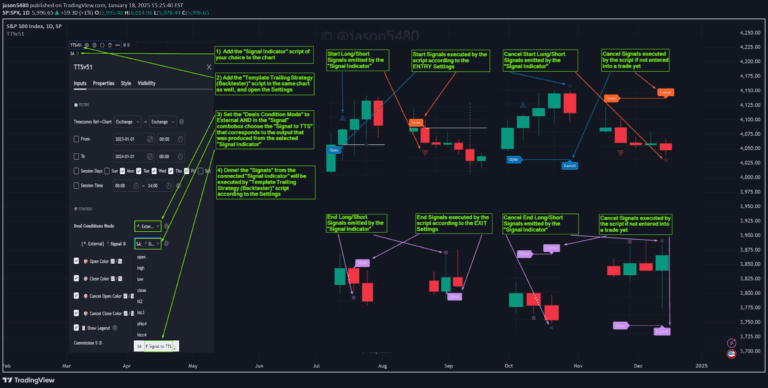
A flexible trading strategy framework enabling traders to develop, test, and evaluate custom trading logic with advanced signal management and comprehensive configuration options.
A probabilistic grid tool that visualizes potential price reversal locations using a 10x10 matrix, helping traders understand the likelihood of future market movements.
A comprehensive trend-following indicator using moving averages to identify bullish and bearish market trends across different timeframes with color-coded visual alerts.
The Double Ribbon indicator combines two Simple Moving Average ribbons to assess market trends and momentum, providing a visual and quantitative analysis of market direction and strength.
A trading indicator designed to backtest the Defining Range (DR) concept, allowing traders to analyze session performance relative to predefined price ranges.
A TradingView indicator that calculates trend reversal probability by analyzing moving average slopes and their rate of change to help traders identify potential market trend shifts.
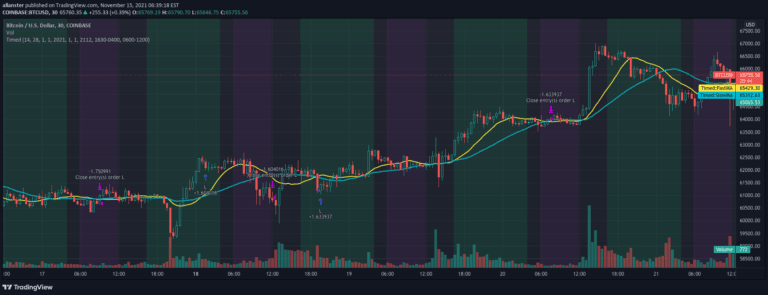
A script demonstrating time range backtesting techniques for trading strategies, enabling precise testing of entry and exit points within specific date ranges.
A powerful trading indicator combining VWAP and EMA to generate buy and sell signals with AI-inspired confidence scoring, helping traders identify high-probability trend continuation opportunities.
Likes, views, and comments are historical TradingView snapshots. They describe attention, not trading performance.