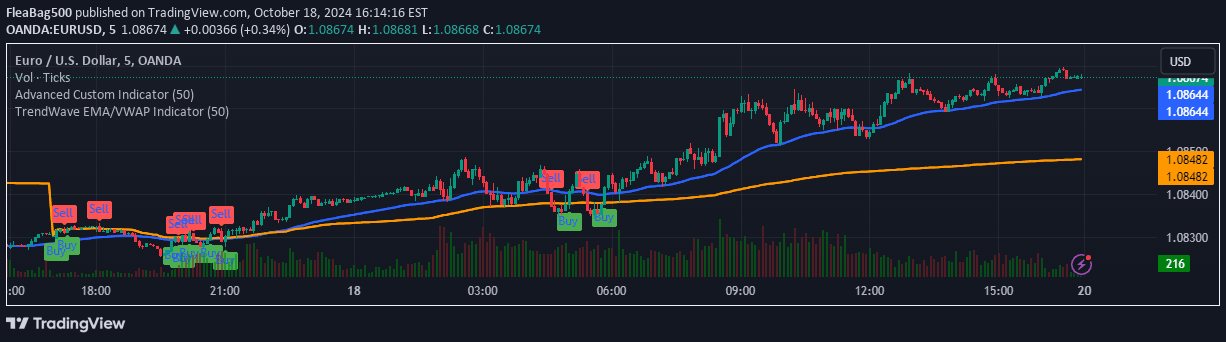
A powerful trading indicator combining VWAP and EMA to generate buy and sell signals with AI-inspired confidence scoring, helping traders identify high-probability trend continuation opportunities.
Explore complementary indicator rolesHow it works
The VWAP + EMA Retracement Indicator generates signals by analyzing price movement relative to Volume Weighted Average Price and two Exponential Moving Averages. It identifies potential trend continuation by looking for price pullbacks within a specific EMA zone and requires strong bullish or bearish candle confirmations.
The indicator calculates a confidence score based on candle strength and proximity to VWAP, providing traders with a quantitative measure of signal reliability. It also includes a unique cooldown mechanism that prevents signal overcrowding by allowing only the first signal within a user-defined period, ensuring cleaner and more focused trading insights.
Why it may be useful
By integrating multiple technical analysis components, this indicator offers traders a sophisticated yet accessible tool for identifying high-probability trading opportunities. Its AI-inspired confidence scoring transforms complex market analysis into an intuitive, easy-to-understand visual representation that helps traders make more informed decisions.
The indicator's ability to filter signals and provide context through confidence scores reduces emotional trading and helps traders focus on high-quality setups. Its flexible customization options allow traders of different styles and experience levels to adapt the tool to their specific trading approach and risk tolerance.
When to explore it
The VWAP + EMA Retracement Indicator performs best in trending markets with clear directional movement, making it ideal for traders seeking to capture momentum-based trades. It is particularly effective on 15-minute charts but can be adapted to various timeframes, offering versatility across different trading styles and asset classes.
Traders should use this indicator in conjunction with other risk management strategies, such as setting appropriate stop-loss levels and maintaining a disciplined approach to position sizing. It is most valuable when market conditions exhibit clear trend characteristics and when price is showing consistent movement within defined support and resistance zones.
Keep exploring
What we’ve verified
Access, alerts and repainting behaviour have not been independently verified for this indicator. Check the creator’s current publication and settings.
General descriptions and classifications are recovered research. Verified details above identify the specific checks we have completed. Check the creator’s current publication for later changes.