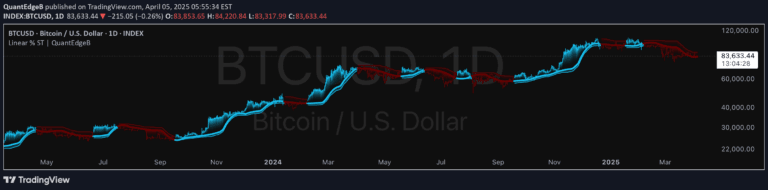
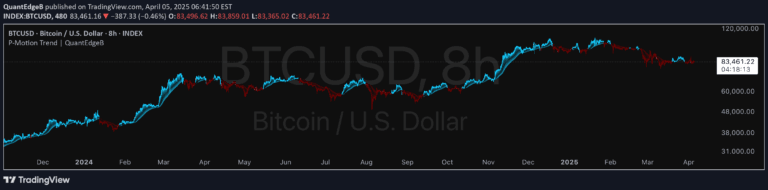
A trend indicator that uses linear regression to color candles and plot an average line, helping traders identify market direction and potential support/resistance levels.
Explore complementary indicator rolesHow it works
The indicator operates by calculating two linear regression lines with different lengths based on a predefined parameter. It uses these calculations to dynamically color price candles, indicating the current trend direction. The short-term and long-term regression lines are derived from the same base parameter, with the longer line having a significantly extended calculation period.
The tool also plots an average line between these two regression lines, which can serve multiple analytical purposes. Traders can use this average line as a potential support and resistance indicator or as a trend line for analyzing potential price breakouts and market movements.
Why it may be useful
Understanding trend direction is crucial for making informed trading decisions, and this indicator provides a visual and quantitative method for tracking market momentum. By color-coding candles and generating a trend line, traders can quickly assess the current market sentiment and potential directional shifts without complex manual calculations.
The dual regression approach offers a nuanced view of market trends, allowing traders to distinguish between short-term fluctuations and longer-term directional movements. This can help traders make more strategic entry and exit decisions, reducing the risk of trading against the prevailing market trend.
When to explore it
This indicator is most effective in markets with clear trending characteristics, such as forex, stocks, and cryptocurrency markets. It performs best in timeframes that allow for sufficient data points to generate meaningful regression lines, typically ranging from 5-minute to daily charts.
Traders should use this tool in conjunction with other technical analysis methods to confirm signals. The indicator is particularly useful during periods of consistent market movement, where trend identification can provide a significant advantage. It may be less reliable during highly volatile or choppy market conditions where price action becomes more erratic and less predictable.
Keep exploring
What we’ve verified
Access, alerts and repainting behaviour have not been independently verified for this indicator. Check the creator’s current publication and settings.
General descriptions and classifications are recovered research. Verified details above identify the specific checks we have completed. Check the creator’s current publication for later changes.