
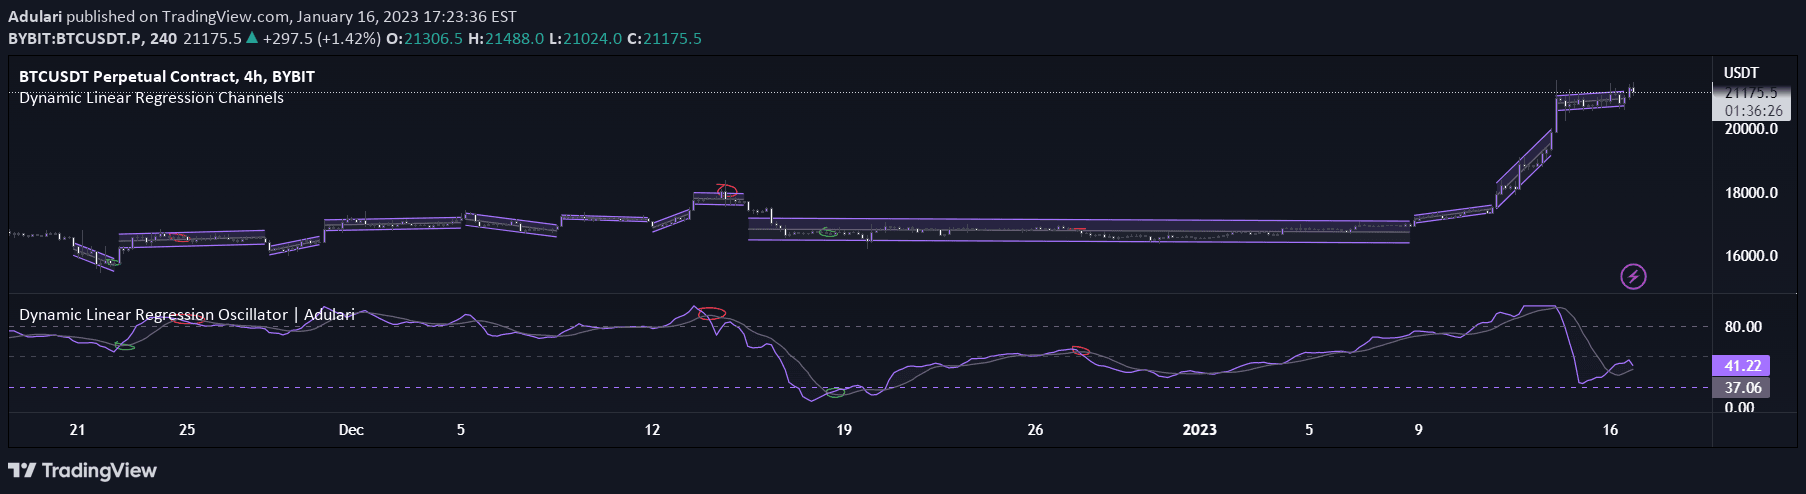
A dynamic linear regression oscillator that visualizes price trends by detecting ranges and calculating deviation from a baseline, helping traders identify potential trend reversals and market momentum.
Explore complementary indicator rolesHow it works
The indicator begins by using pivot detection to automatically determine price ranges in the market. It calculates the middle of these ranges and then measures how far the current price deviates from this baseline by comparing the current high or low to the middle line.
The deviation is then smoothed using a moving average and rescaled to provide proportionate context with recent price action. This process creates an oscillator value that shows how significantly the price has moved away from its typical range, helping traders understand current market dynamics.
Why it may be useful
This signal provides traders with a sophisticated method of understanding market trends beyond simple price movement. By quantifying price deviation and automatically detecting market ranges, it offers insights into potential trend strength and weakness that might not be immediately visible through traditional price charts.
The oscillator helps traders identify potential reversal points by showing when prices are unusually far from their baseline, which can signal overbought or oversold conditions. Its built-in rescaling functionality ensures that the indicator remains relevant and adaptable to changing market conditions.
When to explore it
The linear regression oscillator works best in markets with clear trend movements and defined price ranges. It is particularly effective in identifying potential trend reversals and measuring momentum in financial instruments that exhibit consistent directional movements.
Traders should use this indicator in conjunction with other technical analysis tools, as it provides a nuanced view of market dynamics. It is most valuable when combined with volume indicators, support and resistance levels, and other trend-confirming signals to create a comprehensive trading strategy.
Keep exploring
What we’ve verified
Access, alerts and repainting behaviour have not been independently verified for this indicator. Check the creator’s current publication and settings.
General descriptions and classifications are recovered research. Verified details above identify the specific checks we have completed. Check the creator’s current publication for later changes.


