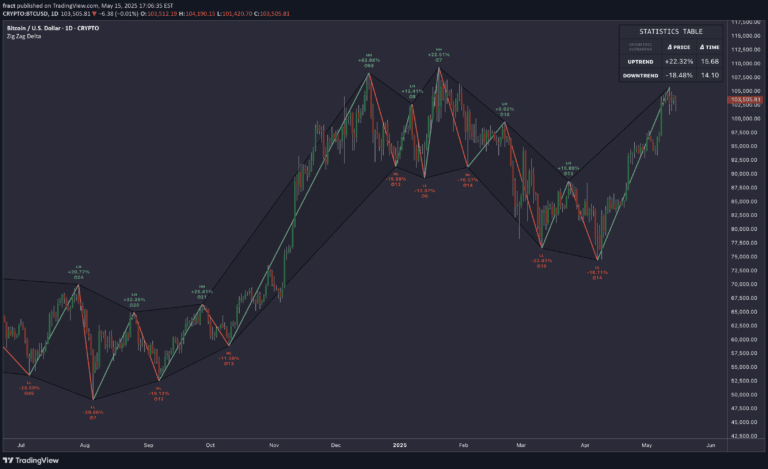
A specialized oscillator that calculates price range differences and indicates market trending strength by comparing current and previous closing prices.
Explore complementary indicator rolesHow it works
The indicator first determines market trend direction by comparing current and previous closing prices. When the current close is above the previous close, it calculates the oscillator value using the formula (high - low) / close, and when the current close is below the previous close, it calculates using (low - high) / close.
After initial calculation, the value is smoothed using a moving average and then rescaled to ensure consistent and comparable values across different market conditions. The rescaling process involves transforming the original value into a new range, which helps traders interpret the indicator more effectively.
Why it may be useful
This indicator provides traders with a nuanced view of market momentum and potential trend reversals by quantifying price range dynamics. It offers insights into market psychology by showing how price fluctuations relate to closing prices, which can help traders understand underlying market sentiments.
By presenting trend strength through a visual oscillator, traders can quickly assess whether bullish or bearish momentum is building. The indicator's ability to show potential trend reversals and weakening trends makes it a valuable tool for identifying potential entry and exit points in various market conditions.
When to explore it
The indicator works best in markets with clear trending characteristics, where price movements show consistent directional bias. Traders should use it alongside other technical analysis tools to confirm signals and reduce false positives, particularly in volatile or ranging markets.
It is most effective when applied to liquid markets with sufficient price action, such as major forex pairs, stock indices, and actively traded commodities. Traders should pay special attention to its signals during key market sessions and around significant economic events that can influence price dynamics.
Keep exploring
What we’ve verified
Access, alerts and repainting behaviour have not been independently verified for this indicator. Check the creator’s current publication and settings.
General descriptions and classifications are recovered research. Verified details above identify the specific checks we have completed. Check the creator’s current publication for later changes.