
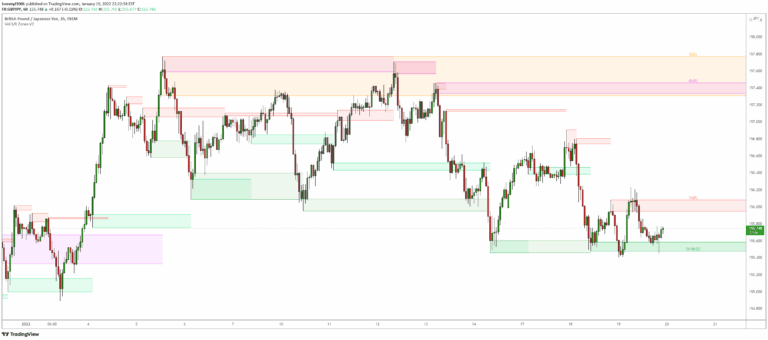
Volume-based Support & Resistance Zones
An advanced Support & Resistance indicator that identifies significant price zones using volume and fractal highs/lows, helping traders visualize potential trend reversals and continuations.
Explore 11,183 indicators. Filter beyond the obvious.
Discover the tools that fit the way you trade.
11,183 tools to explore
An advanced Support & Resistance indicator that identifies significant price zones using volume and fractal highs/lows, helping traders visualize potential trend reversals and continuations.
A Linear Regression Channel indicator that tracks price trends, identifies channel breakouts, and analyzes momentum direction using dynamic visual signals and customizable settings.
An advanced all-in-one trading strategy builder that combines over 30 indicators to generate custom buy and sell signals across multiple timeframes and trading styles.
A technical analysis tool that identifies potential trend reversals by tracking momentum and trend exhaustion phases across bullish, bearish, and ranging markets.
ICT Killzones Toolkit is a comprehensive trading analysis system that identifies key market zones, patterns, and institutional trading levels using multiple price action components.
Fair Value Gaps (FVG) identify market imbalances between buyers and sellers, highlighting potential support and resistance levels where price movements might reverse or continue.
A technical analysis script that identifies cup-like price formations by creating channels and tracking potential breakout points in financial markets using specific bar search and channel width parameters.
A trading indicator that develops higher timeframe bias by analyzing previous day/week high and low price levels, providing a strategic approach to anticipating potential price movements.
A market structure indicator that identifies trend reversals and continuations by tracking protected highs and lows, helping traders recognize significant price movement shifts.
A trading indicator that identifies swing failure patterns by detecting price movements that exceed and then retreat from key swing levels, potentially signaling trend reversals.
A trading tool highlighting specific time-based market zones and Fibonacci retracements to identify optimal entry points across different forex trading sessions.
A dynamic trend channel indicator that identifies market trends, projects future prices, and provides visual signals for potential trade opportunities using SMA and volatility calculations.
Likes, views, and comments are historical TradingView snapshots. They describe attention, not trading performance.
