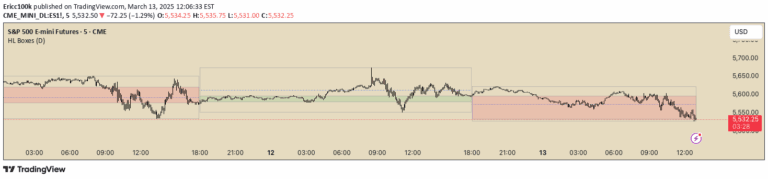
A market structure indicator that identifies trend reversals and continuations by tracking protected highs and lows, helping traders recognize significant price movement shifts.
Explore complementary indicator rolesHow it works
The indicator identifies market structure by analyzing swing pivots using a unique protected high and low methodology. It determines significant price levels by comparing pivots against a specified number of bars to the left and right, creating a more nuanced approach to identifying trend changes.
When a Break of Structure (BOS) or Market Structure Shift (MSS) occurs, the indicator looks back to establish protected highs and lows. For a bullish scenario, this means identifying the lowest low in the range after a price close above a previous protected high, creating a new reference point for potential trend continuation or reversal.
Why it may be useful
This market structure approach provides traders with a more dynamic and context-aware method of identifying potential trend changes and continuations. By using protected highs and lows, the indicator offers a more robust way to track price movements, reducing false signals and providing clearer trend information.
The methodology helps traders make more informed decisions by offering visual cues about market structure, trend direction, and potential entry or exit points. It allows for a more sophisticated understanding of price action beyond traditional pivot point analysis.
When to explore it
The indicator is most effective in markets with clear trending behavior, where price movements show distinct directional shifts. It works particularly well in timeframes that allow for meaningful swing highs and lows to develop, such as daily, 4-hour, and 1-hour charts.
Traders should use this indicator in conjunction with other technical analysis tools to confirm signals and validate potential trade setups. It is especially useful in volatile markets where trend identification can be challenging, providing a structured approach to understanding price action and market dynamics.
Keep exploring
What we’ve verified
Access, alerts and repainting behaviour have not been independently verified for this indicator. Check the creator’s current publication and settings.
General descriptions and classifications are recovered research. Verified details above identify the specific checks we have completed. Check the creator’s current publication for later changes.