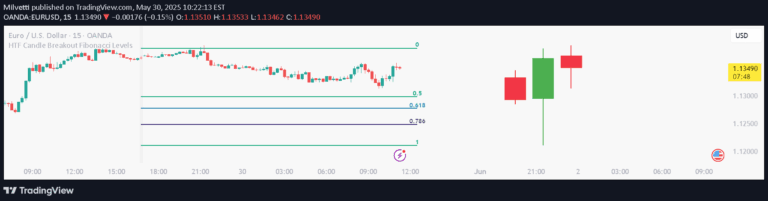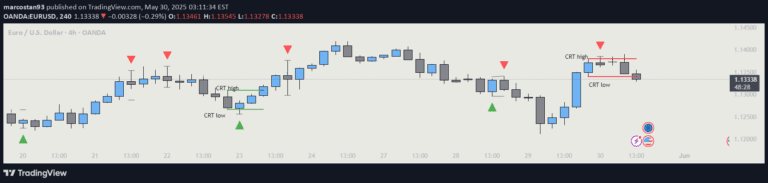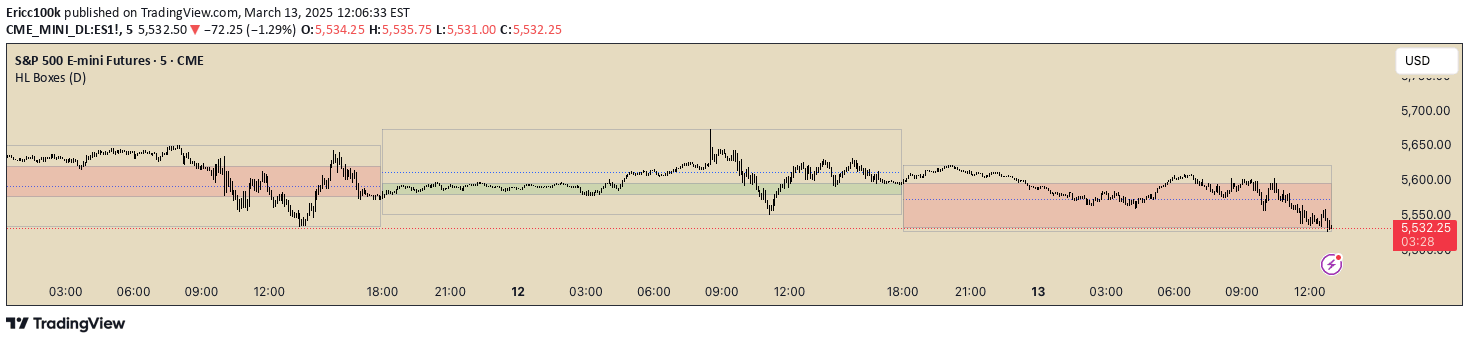
A trading visualization tool that maps higher time frame candles onto lower time frame charts, providing a comprehensive view of price action and market structure across different time intervals.
Explore complementary indicator rolesHow it works
The indicator draws visual boxes representing higher time frame (HTF) candles directly onto a lower time frame (LTF) chart, capturing the high, low, and body of each candle. These boxes are created by identifying key price levels from the larger time frame and translating them onto the smaller chart, allowing traders to see how higher-level price structures interact with current market movements.
The visualization includes customizable elements like box colors, line styles, and additional features such as midline markers at the 50% point of each box. By overlaying these HTF candle representations, traders can quickly understand the broader market context and potential support or resistance levels that might influence current price action.
Why it may be useful
Understanding higher time frame market structure is crucial for making more informed trading decisions, as it provides context beyond the immediate price movements. This visualization helps traders identify potential trend directions, key support and resistance levels, and overall market sentiment across different time scales.
By presenting HTF information in a visually intuitive manner, traders can more easily recognize significant price patterns, potential reversal zones, and critical market levels that might not be apparent when focusing solely on the current time frame.
When to explore it
This indicator is most effective when trading instruments with clear, divisible time frames, such as major forex pairs or liquid stock indices. It works best when there is a meaningful relationship between the higher and lower time frames, allowing for accurate translation of market structure.
Traders should use this tool during periods of consistent market trends, when understanding broader market context can provide a strategic advantage. It is particularly useful for identifying potential entry and exit points, managing risk, and developing a more comprehensive view of market dynamics across different time scales.
Keep exploring
What we’ve verified
Access, alerts and repainting behaviour have not been independently verified for this indicator. Check the creator’s current publication and settings.
General descriptions and classifications are recovered research. Verified details above identify the specific checks we have completed. Check the creator’s current publication for later changes.