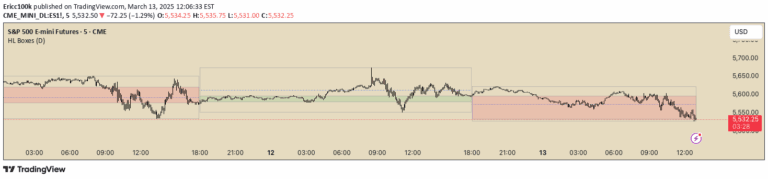
A dynamic 4-hour price box indicator that visualizes market sentiment by color-coding and tracking high and low price levels in real-time across different timeframes.
Explore complementary indicator rolesHow it works
The indicator creates a dynamic box based on the most recent 4-hour candle's high, low, and open prices. As the current price evolves, the box updates in real-time, providing a visual representation of the 4-hour price range and market dynamics.
The box's color changes based on price position relative to the 4-hour open, with green indicating bullish sentiment and red signaling bearish conditions. This color-coding helps traders quickly interpret market direction and potential price movements across various intraday timeframes.
Why it may be useful
This indicator provides traders with an intuitive visual tool to understand market sentiment and price dynamics at a glance. By dynamically tracking price levels and showing market direction through color-coding, it helps traders make more informed decisions about potential entry and exit points.
The versatility of the indicator across different timeframes makes it a valuable tool for traders seeking to understand market trends and price action. Its real-time updates and clear visual representation can help reduce emotional trading and provide objective insights into market movements.
When to explore it
The indicator is most effective during trending markets where clear price direction can be identified through the box's color and position. Traders can use it to spot potential reversal points, breakout opportunities, and mean reversion scenarios across different trading styles and timeframes.
It is particularly useful for traders looking to validate price action signals, identify key support and resistance levels, and gain a quick understanding of market sentiment. The indicator can be especially powerful when combined with other technical analysis tools to confirm trading decisions.
Keep exploring
What we’ve verified
Access, alerts and repainting behaviour have not been independently verified for this indicator. Check the creator’s current publication and settings.
General descriptions and classifications are recovered research. Verified details above identify the specific checks we have completed. Check the creator’s current publication for later changes.