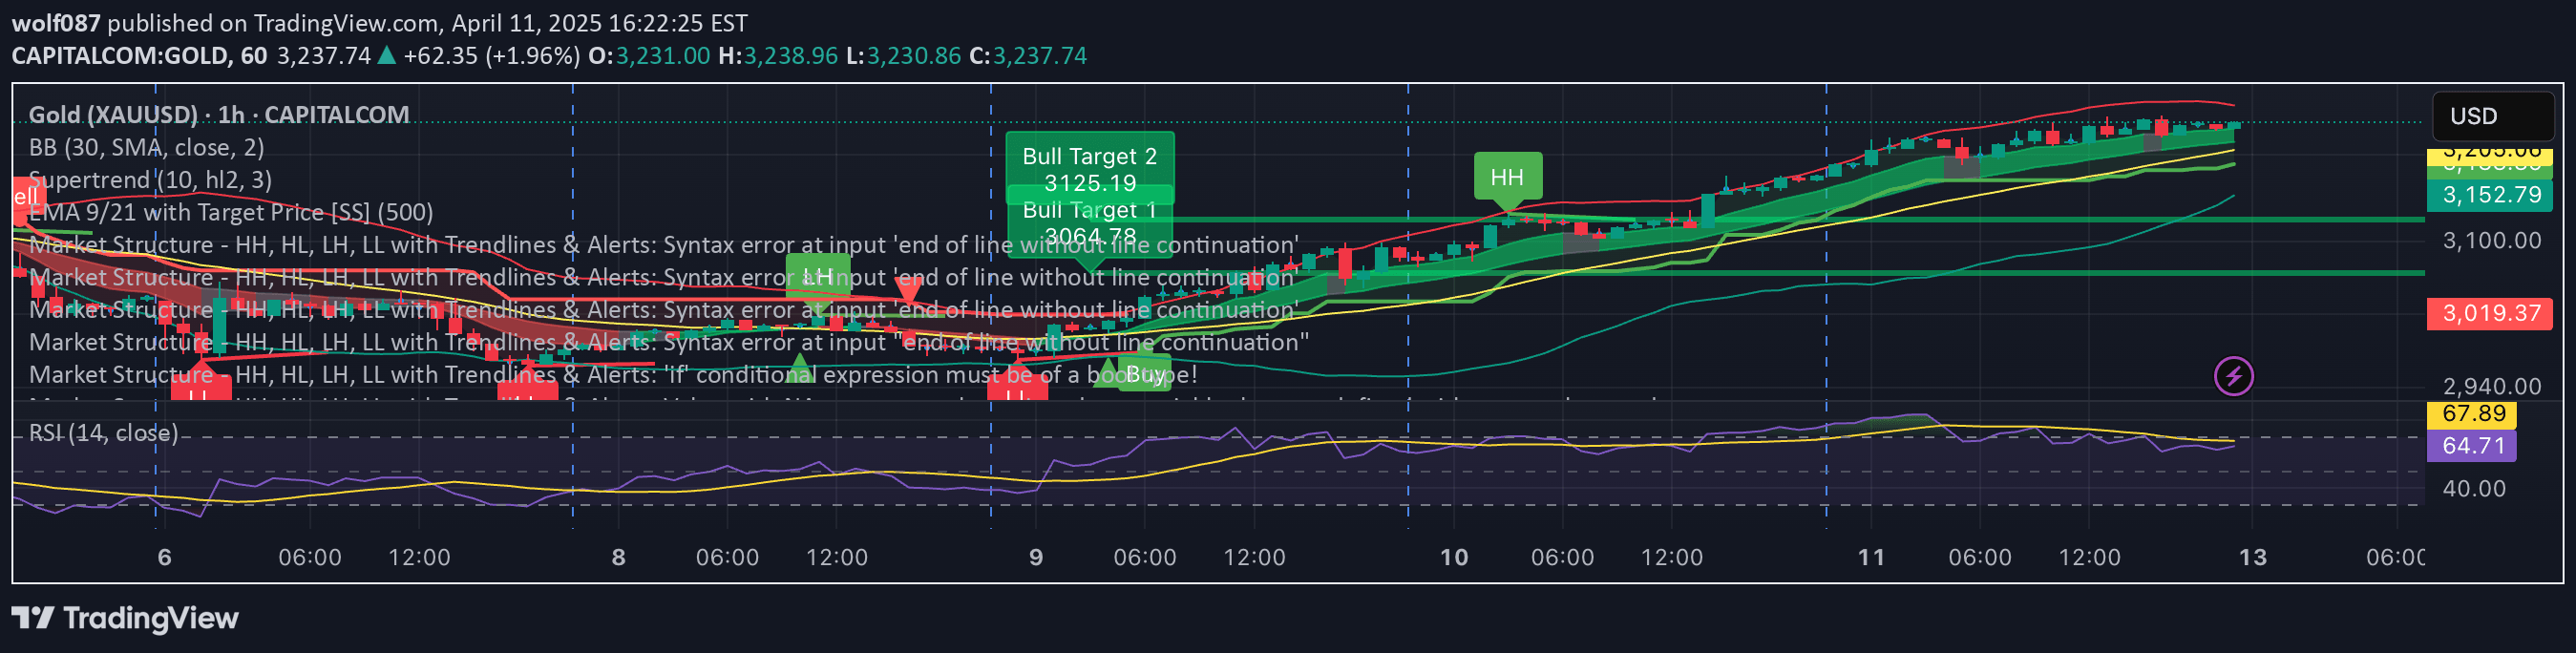
A dynamic Fibonacci retracement indicator that automatically plots levels on a lower timeframe after detecting a breakout on a higher timeframe, providing contextual trading opportunities.
Explore complementary indicator rolesHow it works
The indicator monitors higher timeframe (HTF) candles for breakout conditions, specifically when a candle closes beyond the high or low of the previous candle. Once a breakout is detected, it automatically generates Fibonacci retracement levels on the lower timeframe (LTF) chart, providing traders with precise potential reversal or entry zones.
These Fibonacci levels remain active until the next HTF candle forms, allowing traders to identify potential retracement opportunities with greater contextual precision. The indicator also provides a live preview of the last three HTF candles, updating in real-time to help traders understand the broader market structure and potential trading scenarios.
Why it may be useful
Fibonacci retracement levels are crucial tools for identifying potential support and resistance zones based on key mathematical ratios derived from significant price movements. By automating the process of detecting and plotting these levels across different timeframes, traders can quickly identify high-probability trading opportunities without manual calculation.
The indicator's ability to dynamically update levels based on HTF breakouts provides traders with a more contextual and adaptive approach to technical analysis. This automated method reduces subjective interpretation and helps traders make more informed decisions by aligning lower timeframe entries with higher timeframe market structure.
When to explore it
This indicator is most effective in trending markets where clear breakouts and retracements are more likely to occur. Traders can benefit from using it across various financial instruments and timeframes, particularly when seeking precise entry and exit points during potential trend continuations or reversals.
The tool is especially valuable for traders who want to combine multiple timeframe analysis with Fibonacci-based strategies. It works best when used in conjunction with other technical indicators and during periods of moderate market volatility, where price movements are more predictable and structured.
Keep exploring
What we’ve verified
Access, alerts and repainting behaviour have not been independently verified for this indicator. Check the creator’s current publication and settings.
General descriptions and classifications are recovered research. Verified details above identify the specific checks we have completed. Check the creator’s current publication for later changes.