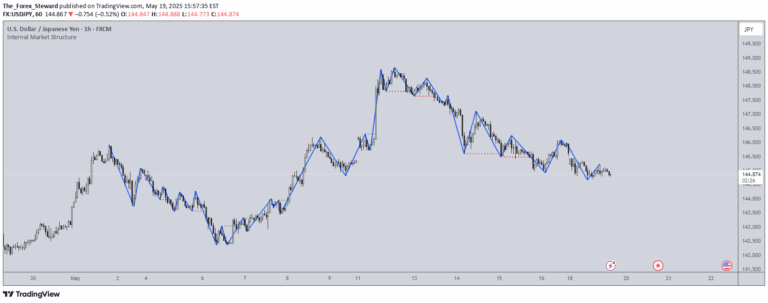
A Pine Script that identifies market structure patterns like Higher Highs, Higher Lows, Lower Highs, and Lower Lows, drawing trendlines and providing alerts for trend analysis.
Explore complementary indicator rolesHow it works
The script uses ta.pivothigh and ta.pivotlow functions to detect significant swing points in price action, dynamically adjusting the pivot length based on the chart's timeframe. It identifies key market structure patterns such as Higher Highs (HH), Higher Lows (HL), Lower Highs (LH), and Lower Lows (LL) by comparing current swing points to previous ones.
For each identified pattern, the script automatically draws trendlines connecting the corresponding swing points and places labels to mark the specific type of market structure. This visual representation helps traders quickly understand the current price trends and potential trend changes.
Why it may be useful
Market structure analysis is crucial for understanding price trends and potential reversals, providing traders with a systematic approach to interpreting market movements. By identifying Higher Highs, Higher Lows, Lower Highs, and Lower Lows, traders can gain insights into the current trend direction and momentum of a financial instrument.
The automatic trendline drawing and labeling feature simplifies complex price action analysis, allowing traders to quickly recognize important pattern formations. These visual cues help traders make more informed decisions about entry and exit points, trend continuation, and potential trend reversals.
When to explore it
This market structure script is most effective in trending markets with clear directional movements, helping traders identify and confirm trend strength and potential changes. It works well across different timeframes, from short-term scalping to longer-term swing trading, making it a versatile tool for various trading strategies.
Traders should use this script in conjunction with other technical analysis tools and indicators to validate signals and reduce false positives. It is particularly useful during periods of sustained trends, breakouts, and when looking to identify potential trend reversals or continuation patterns.
Keep exploring
What we’ve verified
Access, alerts and repainting behaviour have not been independently verified for this indicator. Check the creator’s current publication and settings.
General descriptions and classifications are recovered research. Verified details above identify the specific checks we have completed. Check the creator’s current publication for later changes.