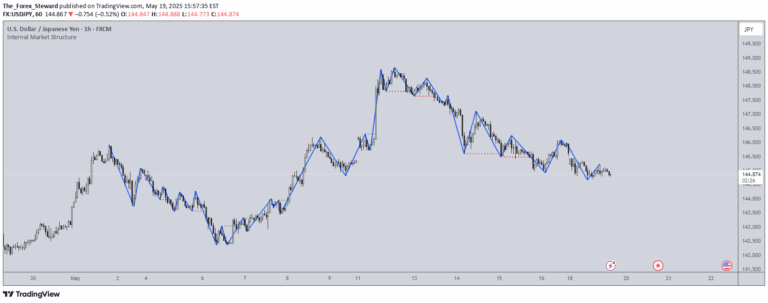
A market structure indicator that identifies price action trends by analyzing bullish and bearish candle sequences, providing insights into potential directional changes and trading opportunities.
Explore complementary indicator rolesHow it works
The indicator analyzes market structure by identifying sequential bullish and bearish candles to determine potential trend shifts. It calculates structure highs and lows based on consecutive bullish or bearish candle patterns, marking significant points with circle labels.
The algorithm tracks key points like Inducement Liquidity (ILQ), Total Liquidity Query (TLQ), and Efficient Price Action (EPA) to provide a comprehensive view of market movements and potential trading signals.
Why it may be useful
This indicator offers traders a nuanced approach to understanding market dynamics by breaking down price action into meaningful structural components. By identifying key turning points and potential trend reversals, it helps traders make more informed decisions about market entry and exit points.
The tool's ability to visualize market structure through various components like extreme zones, valid trading ranges, and directional changes provides traders with a multi-dimensional view of price action that goes beyond traditional pivot point analysis.
When to explore it
The indicator is most effective in markets with clear trending characteristics and where price action plays a significant role in determining market direction. It works best in timeframes that align closely with the chart's current timeframe to minimize potential calculation errors.
Traders should utilize this signal when seeking to identify potential trend reversals, liquidity zones, and efficient price action setups, particularly in markets with distinct bullish and bearish candle patterns.
Keep exploring
What we’ve verified
Access, alerts and repainting behaviour have not been independently verified for this indicator. Check the creator’s current publication and settings.
General descriptions and classifications are recovered research. Verified details above identify the specific checks we have completed. Check the creator’s current publication for later changes.