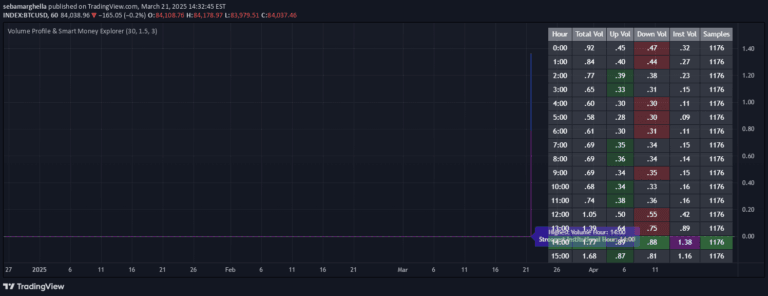
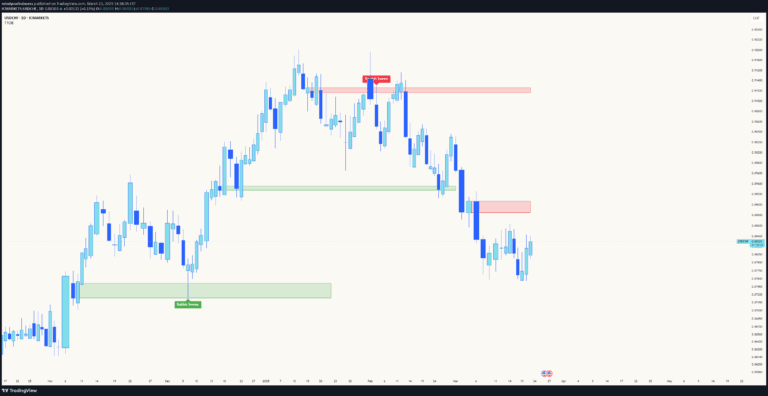
Smart Market Matrix is an advanced intraday trading indicator that detects price pivots, liquidity traps, and breakouts with comprehensive market context analysis.
Explore complementary indicator rolesHow it works
The Smart Market Matrix operates by analyzing multiple technical parameters simultaneously to generate trading signals. It uses volume-weighted moving averages, average true range, and on-balance volume to detect potential market movements and price traps.
The indicator calculates pivot points, identifies volume spikes, measures candle characteristics, and evaluates trend strength through multiple timeframes. By combining these sophisticated algorithms, it creates a comprehensive framework for detecting potential entry and exit points with high precision.
Why it may be useful
Traders benefit from this indicator's multi-dimensional approach to market analysis, which reduces emotional decision-making and provides objective, data-driven insights. It transforms complex market dynamics into clear, actionable signals that help traders understand market structure and potential price movements.
The Smart Market Matrix goes beyond traditional indicators by integrating volatility, trend, and volume context into a single comprehensive tool. This holistic approach allows traders to make more informed decisions by understanding the broader market context rather than relying on isolated technical signals.
When to explore it
The Smart Market Matrix is most effective during volatile market conditions with clear price action and substantial trading volume. It performs exceptionally well in liquid markets such as major forex pairs, stock indices, and high-volume cryptocurrency pairs.
Traders should utilize this indicator during active trading sessions, particularly during market open hours when volatility and volume are highest. It is particularly useful for traders seeking to identify potential breakouts, traps, and trend confirmations across different timeframes and market environments.
Keep exploring
What we’ve verified
Access, alerts and repainting behaviour have not been independently verified for this indicator. Check the creator’s current publication and settings.
General descriptions and classifications are recovered research. Verified details above identify the specific checks we have completed. Check the creator’s current publication for later changes.