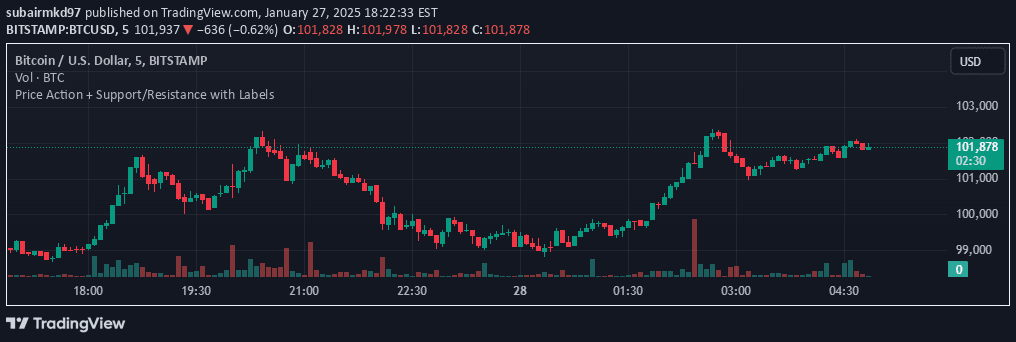
Zigzag is an analytical indicator that connects consecutive price pivots to help traders identify market trends, price waves, and classic chart patterns across different timeframes.
Explore complementary indicator rolesHow it works
The Zigzag indicator works by filtering and connecting significant price pivot points, creating a simplified representation of price movements. It identifies high and low points based on a specified percentage or time frame deviation, effectively filtering out minor price fluctuations to highlight more meaningful market trends.
By analyzing both short-term and long-term zigzag lines, traders can visualize price waves and identify potential pattern formations. The indicator uses configurable settings like time frame range and display modes to adapt to different market conditions and trading styles, allowing for customized analysis of price movements.
Why it may be useful
The Zigzag indicator is crucial for traders because it simplifies complex price movements and helps identify underlying market trends with greater clarity. By filtering out noise and highlighting significant price pivots, it enables traders to recognize classic chart patterns and understand market dynamics more effectively.
Moreover, the indicator supports multiple trading approaches by providing insights across different timeframes. Its ability to reveal price waves and potential trend reversals makes it a versatile tool for technical analysis, helping traders make more informed decisions about market entry and exit points.
When to explore it
The Zigzag indicator is most effective when used in conjunction with other technical analysis tools to confirm trend directions and potential market reversals. It works particularly well in markets with clear trending characteristics, where price movements show distinct directional momentum and identifiable wave patterns.
Traders should experiment with different time frame settings to optimize the indicator's performance for specific financial instruments and trading styles. It is especially useful when analyzing historical price data, identifying support and resistance levels, and recognizing classic chart patterns like Higher Highs (HH), Lower Lows (LL), and their variations.
Keep exploring
What we’ve verified
Access, alerts and repainting behaviour have not been independently verified for this indicator. Check the creator’s current publication and settings.
General descriptions and classifications are recovered research. Verified details above identify the specific checks we have completed. Check the creator’s current publication for later changes.