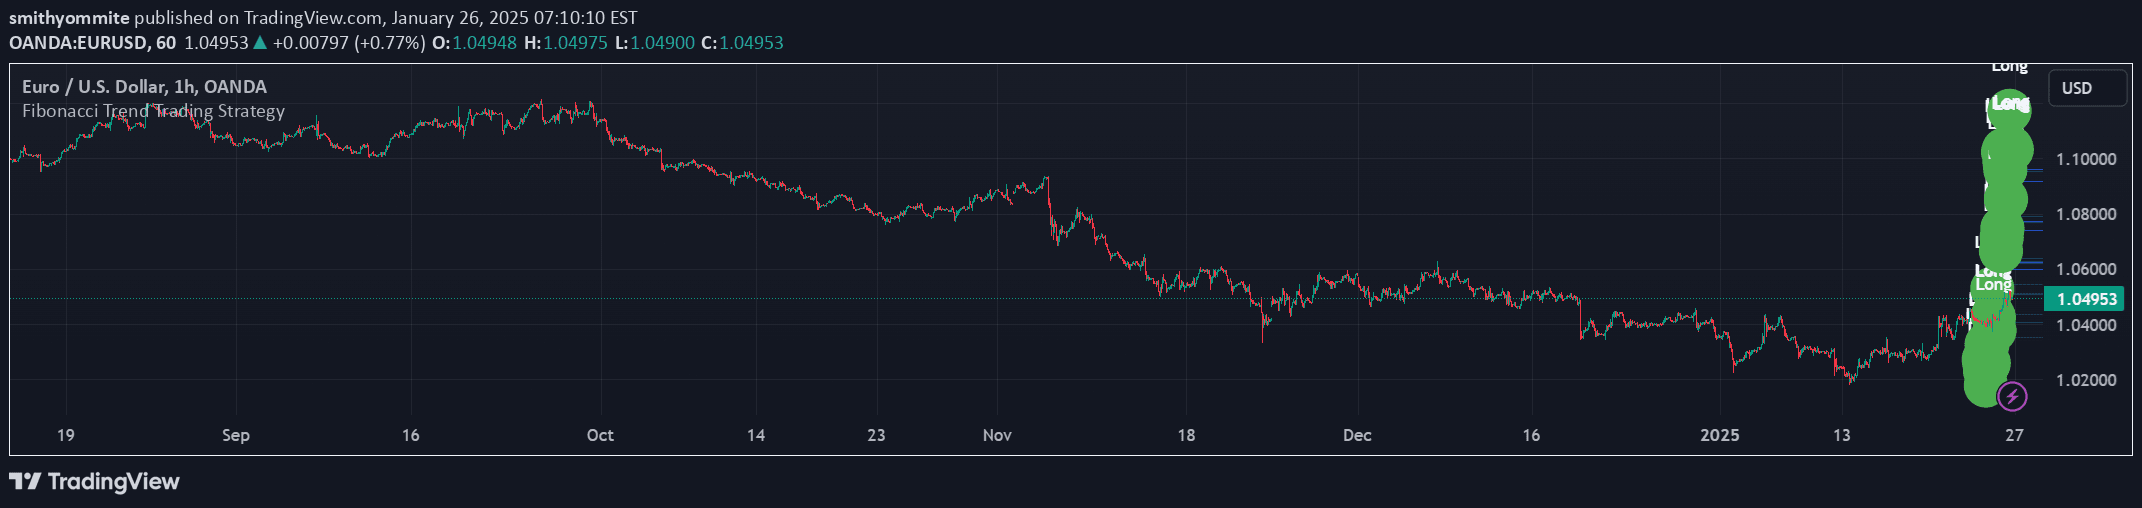
A dynamic Fibonacci indicator that automatically calculates and plots key retracement and extension levels based on recent swing highs and lows, helping traders identify potential support and resistance zones.
Explore complementary indicator rolesHow it works
The Fibonacci indicator works by automatically detecting significant swing highs and lows in recent price action over a user-defined lookback period. It then calculates key Fibonacci retracement levels like 0.236, 0.382, and 0.618, as well as extension levels such as 1.618 and 2.618, which are plotted as visual lines on the chart.
The indicator uses algorithmic detection to mark these swing points with crosses and draws blue dashed lines for retracement levels and green dashed lines for extension levels. It also provides visual alerts and labels with directional arrows to show how price interacts with these important Fibonacci levels.
Why it may be useful
Fibonacci levels are crucial for traders because they help identify potential areas of price reversal, support, and resistance based on key mathematical ratios derived from market movements. By automating the process of detecting and plotting these levels, traders can save significant time and reduce the potential for manual errors in their technical analysis.
The indicator provides a systematic approach to recognizing important price zones, allowing traders to make more informed decisions about potential entry and exit points. Its visual representation makes it easier to quickly understand market dynamics and potential price reactions at critical levels.
When to explore it
This Fibonacci indicator is most effective in markets with clear trending or ranging characteristics, where price tends to respect key retracement and extension levels. It works particularly well in timeframes that capture meaningful market swings, such as hourly, daily, or weekly charts for different asset classes.
Traders should use this tool in conjunction with other technical analysis methods, such as candlestick patterns, volume analysis, or trend indicators, to confirm potential trade setups. It is especially useful for identifying potential reversal zones, continuation patterns, and strategic entry or exit points in various trading strategies.
Keep exploring
What we’ve verified
Access, alerts and repainting behaviour have not been independently verified for this indicator. Check the creator’s current publication and settings.
General descriptions and classifications are recovered research. Verified details above identify the specific checks we have completed. Check the creator’s current publication for later changes.