
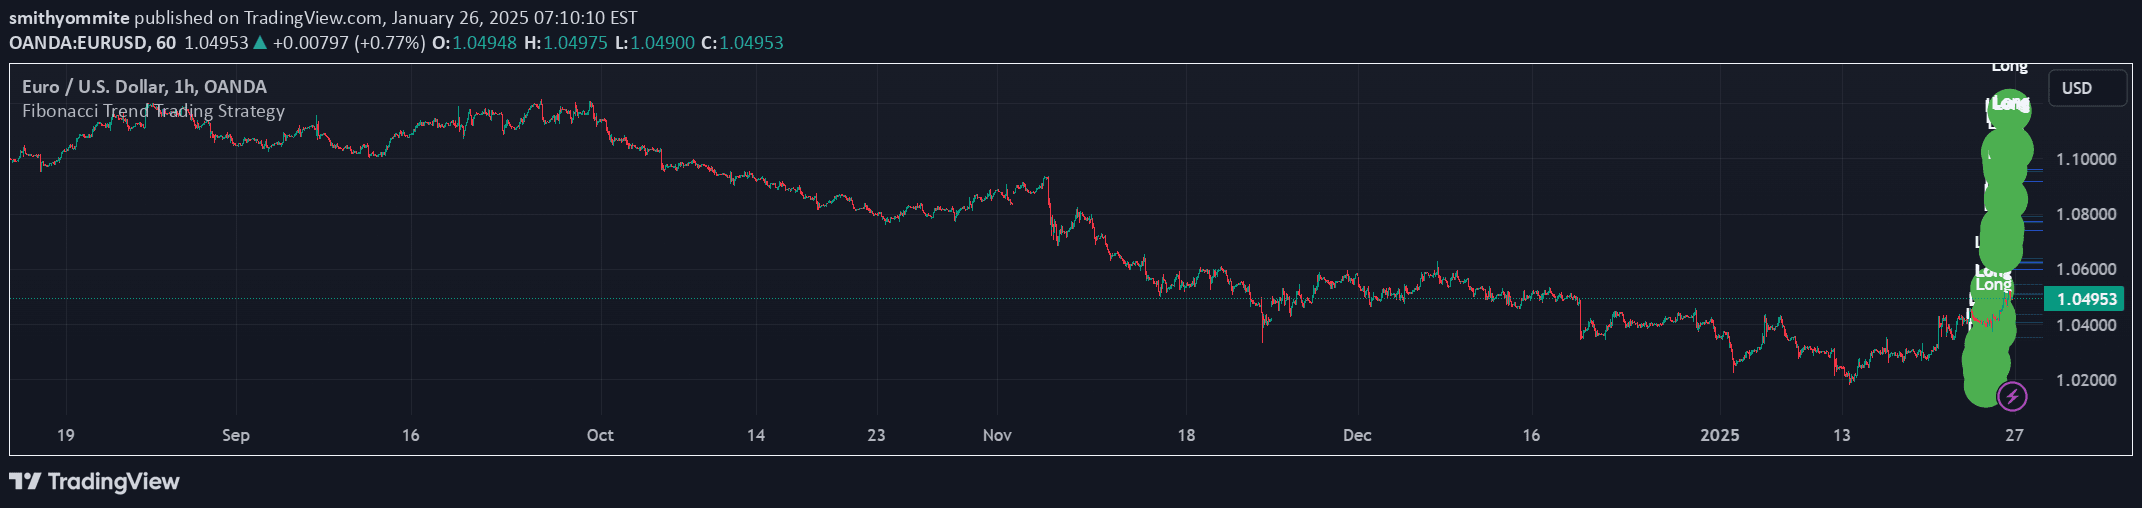
A multi-timeframe trading strategy using Fibonacci extensions and retracements to identify trend direction, entry points, and potential profit targets across weekly, daily, and four-hour charts.
Explore complementary indicator rolesHow it works
The strategy begins by identifying the weekly trend through analyzing Higher Highs (HH) and Lower Lows (LL) to determine market direction. A Fibonacci extension is plotted between significant swing points, creating retracement levels at 0.236, 0.382, and 0.5 to highlight potential reversal zones.
On the daily chart, traders confirm trend continuation by looking for price rejection signals at these Fibonacci levels. The four-hour timeframe provides precise entry points by plotting a Fibonacci extension in the opposite direction of the weekly trend and generating a trade signal when price breaks the current candle's high.
Why it may be useful
This multi-timeframe approach provides traders with a comprehensive view of market dynamics, combining trend analysis with precise entry and exit strategies. By using Fibonacci levels across different timeframes, traders can identify high-probability trade setups with clear risk management parameters.
The strategy offers a structured method for entering trades with defined profit targets and stop-loss levels, reducing emotional decision-making and providing a systematic approach to trading that can be applied across various financial markets and asset classes.
When to explore it
The strategy is most effective in markets with clear trending characteristics, where price tends to respect Fibonacci retracement and extension levels. It works best in liquid markets with sufficient price movement, such as major forex pairs, stock indices, and commodities.
Traders should apply this strategy during periods of sustained market trends, avoiding choppy or highly volatile market conditions that can lead to false signals. It is particularly useful for swing traders looking to capture medium-term price movements with a structured and methodical approach to market analysis.
Keep exploring
What we’ve verified
Access, alerts and repainting behaviour have not been independently verified for this indicator. Check the creator’s current publication and settings.
General descriptions and classifications are recovered research. Verified details above identify the specific checks we have completed. Check the creator’s current publication for later changes.


