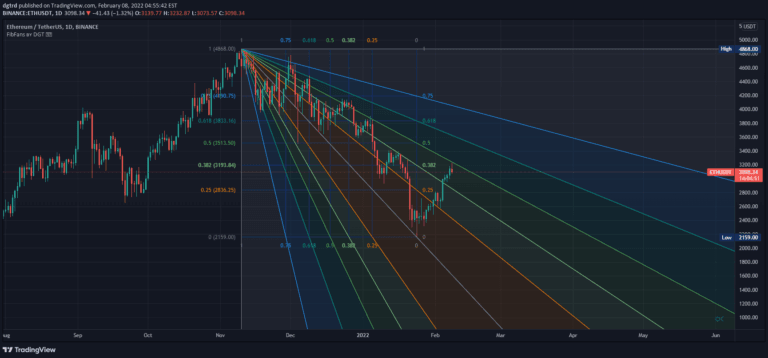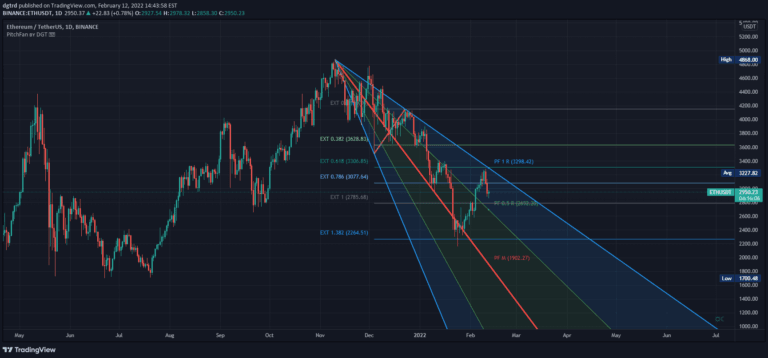
Auto PitchFan, Fib Extension/Retracement and ZigZag by DGT
An advanced trading tool combining PitchFan, Fibonacci Extensions/Retracements, and ZigZag to identify potential support, resistance levels, and trend continuation signals.
Explore 11,183 indicators. Filter beyond the obvious.
Discover the tools that fit the way you trade.
11,183 tools to explore
An advanced trading tool combining PitchFan, Fibonacci Extensions/Retracements, and ZigZag to identify potential support, resistance levels, and trend continuation signals.
Fibonacci Speed and Resistance Fan is an analytical tool that identifies potential support and resistance levels by drawing lines based on Fibonacci percentages to predict trend changes and market movements.
Fibonacci Time-Price Zones is an advanced indicator that combines Fibonacci ratios with time and price analysis, offering multiple geometric visualization methods to identify market turning points.
A comprehensive trading tool combining order blocks and Fibonacci retracements to identify potential market entry and exit points based on significant order zones and mathematical support/resistance levels.
The Gann Box is a technical analysis tool that uses geometric principles to identify potential support and resistance levels, forecast price movements, and analyze market trends.
A dynamic Fibonacci-based indicator that identifies support, resistance, and trend zones using multiple ratio bands to highlight potential price reversal and liquidity sweep points.
A multi-dimensional trading oscillator that uses Fibonacci ratios to analyze market trends, identify retracements, and provide insights into potential price movements across different market conditions.
A multi-timeframe Fibonacci indicator that automatically displays Fibonacci retracements from multiple Zigzag lines, enabling advanced trading analysis and custom alert configurations.
Session Fibonacci Levels indicator dynamically calculates Fibonacci retracement and extension levels within custom trading sessions, helping traders identify potential support and resistance areas.
A sophisticated technical indicator using Fibonacci sequence numbers to create dynamic moving average channels that help traders identify trend direction, potential support/resistance zones, and trade entry points.
A technical analysis tool using Fibonacci levels to identify potential support and resistance zones through both linear and logarithmic methods across different financial instruments.
A multi-timeframe technical analysis tool using Exponential Hull and Hull Moving Averages to generate trading signals and provide market trend insights across different timeframes.
Likes, views, and comments are historical TradingView snapshots. They describe attention, not trading performance.