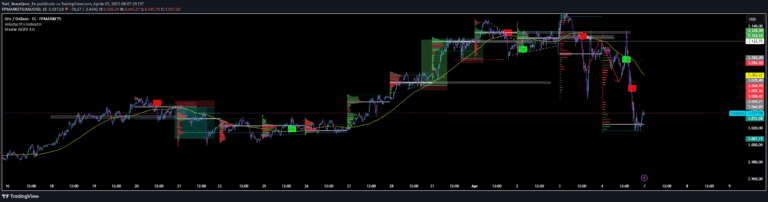
A dynamic Fibonacci-based indicator that identifies support, resistance, and trend zones using multiple ratio bands to highlight potential price reversal and liquidity sweep points.
Explore complementary indicator rolesHow it works
The Fibonacci Band indicator creates dynamic bands around a central trend line using key Fibonacci ratios of 38.2%, 61.8%, and 100%. These bands adapt to price movements, providing visual markers for potential support and resistance levels. The central line changes from solid to dashed to indicate trend direction, with the bands extending into future price bars.
By applying these Fibonacci ratios, the indicator generates mean reversion signals when price moves beyond the 100% band. It also identifies potential liquidity sweep zones at previous high and low points, helping traders understand market structure and potential price reversals.
Why it may be useful
The Fibonacci Band indicator offers traders a sophisticated tool for understanding complex market dynamics through mathematically derived price levels. By integrating Fibonacci ratios with trend detection, traders can gain deeper insights into potential market movements and strategic entry and exit points. The visual representation helps simplify complex price action analysis.
Moreover, the indicator's ability to project future price levels and identify liquidity sweep zones provides traders with a forward-looking perspective. This approach allows for more strategic decision-making, helping traders anticipate potential market movements and identify high-probability trading opportunities.
When to explore it
The Fibonacci Band indicator works best in markets with clear trends and recognizable support and resistance zones. It is particularly effective in volatile markets where price frequently tests key levels and experiences mean reversion. Traders can leverage this tool across various timeframes, from short-term scalping to longer-term swing trading strategies.
The indicator is most powerful when combined with other technical analysis tools, helping to confirm signals and provide additional context. Traders should pay special attention to liquidity sweep points, mean reversion signals, and trend changes indicated by the midline's appearance.
Keep exploring
What we’ve verified
Access, alerts and repainting behaviour have not been independently verified for this indicator. Check the creator’s current publication and settings.
General descriptions and classifications are recovered research. Verified details above identify the specific checks we have completed. Check the creator’s current publication for later changes.