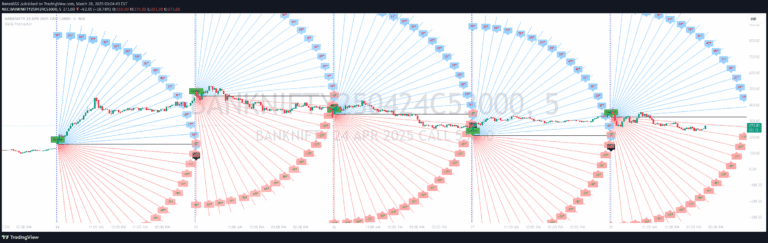
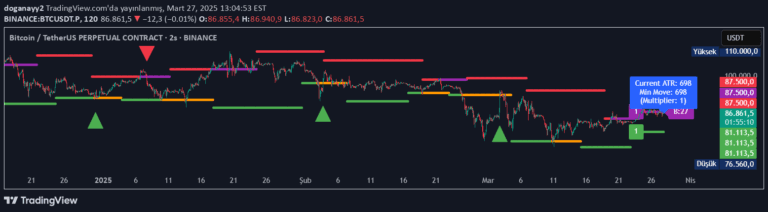
A dynamic trading indicator using Gann Square of 9 methodology to identify trend direction, reversal levels, and potential price movements across multiple market conditions.
Explore complementary indicator rolesHow it works
The Dynamic GANN Square Of 9 Bands uses a specialized grid system to map potential price movements and trend directions. It creates multiple colored lines representing different market insights, with a green 200 EMA line indicating the primary trend direction.
The indicator generates red and grey lines that mark prominent reversal levels and immediate target zones. By customizing the increment value to match specific symbol and price characteristics, traders can adapt the tool to different market environments and enhance its predictive accuracy.
Why it may be useful
The GANN Square Of 9 Bands provides traders with a comprehensive visual framework for understanding potential market movements and trend dynamics. Its unique approach allows traders to identify key reversal levels and trend continuation points with greater precision than standard technical analysis tools.
By offering fixed, parallel levels that remain unaffected by market volatility, this indicator gives traders a stable reference point for making strategic trading decisions. It serves as a leading indicator that can reveal potential trend changes before they become apparent through traditional price action analysis.
When to explore it
The Dynamic GANN Square Of 9 Bands is most effective in trending markets with clear directional movements. Traders should utilize this indicator when seeking to identify potential trend reversals and establish strategic entry and exit points across different timeframes.
It is particularly useful for trend-following strategies and when combined with additional confirmation signals. Traders should apply this tool alongside robust risk management techniques, carefully managing predefined risk and trade quantities to maximize its predictive potential.
Keep exploring
What we’ve verified
Access, alerts and repainting behaviour have not been independently verified for this indicator. Check the creator’s current publication and settings.
General descriptions and classifications are recovered research. Verified details above identify the specific checks we have completed. Check the creator’s current publication for later changes.