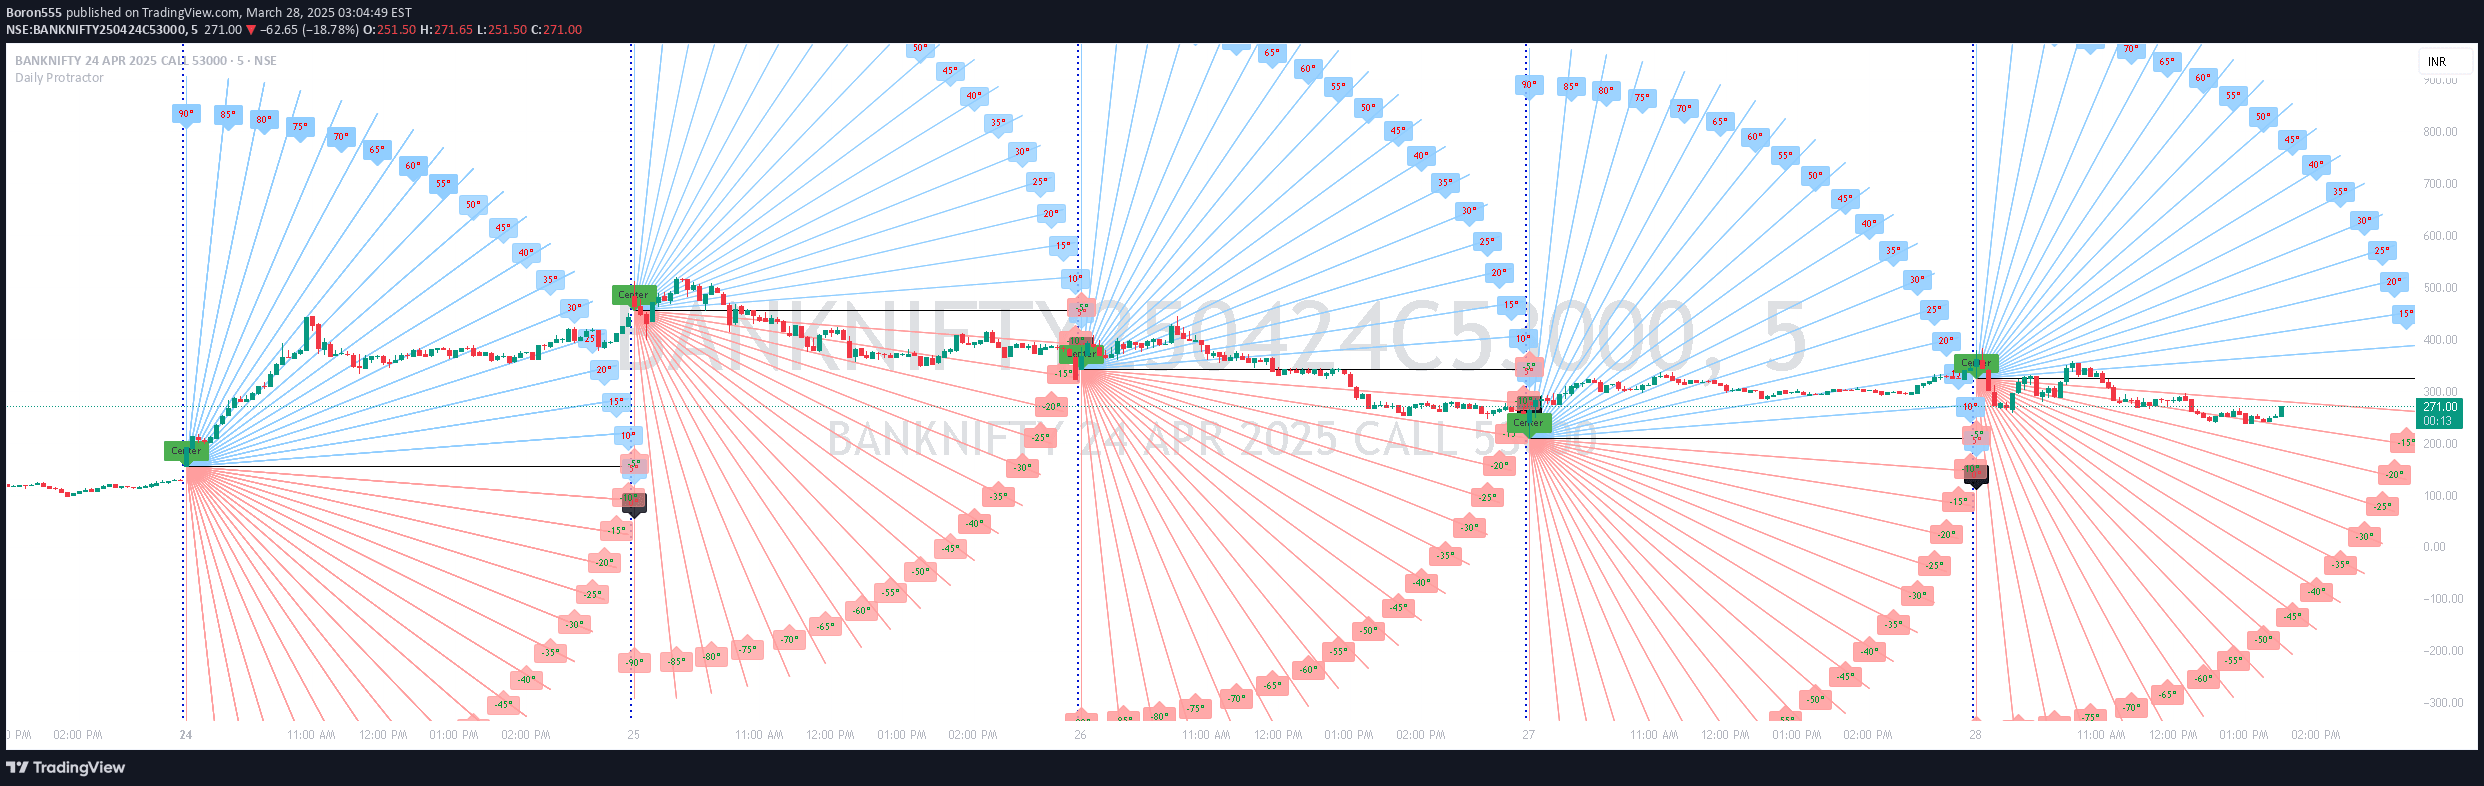
A geometric trading tool that uses a protractor overlay on 5-minute charts to analyze price action through angular measurements, helping traders identify potential support, resistance, and trend directions.
Explore complementary indicator rolesHow it works
The Daily Protractor indicator works by identifying the first 5-minute candle of each trading day and using its low price as the center point for a protractor. It then draws lines at 5-degree intervals radiating from this center point, creating a geometric overlay that spans from 0° to 360° or a half-circle from 91° to 269°.
Traders can customize the protractor's radius in both bars and price units, allowing for flexible scaling to match different chart characteristics. The indicator displays angle measurements with color-coded lines and labels, making it easy to visually interpret potential price levels and trend directions across different trading instruments.
Why it may be useful
The Daily Protractor provides traders with a unique visual tool for analyzing price action through geometric principles, offering an intuitive method to identify potential support and resistance levels. By transforming price movement into angular measurements, traders can gain insights that might not be immediately apparent through traditional technical analysis methods.
This innovative approach allows traders to see price dynamics from a different perspective, potentially revealing hidden patterns and directional cues that could inform more strategic trading decisions. The customizable nature of the protractor means it can be adapted to various market conditions and trading styles, making it a versatile analytical instrument.
When to explore it
The Daily Protractor is most effective when used on 5-minute charts with relatively stable and predictable price movements. It works best for intraday traders who are looking to identify precise entry and exit points based on angular relationships between price movements. Traders should use this tool in conjunction with other technical indicators to confirm potential trading signals.
The indicator is particularly useful in markets with clear trend characteristics and where geometric analysis can provide additional insight into price action. However, it may be less effective in highly volatile markets or for instruments with extreme price fluctuations, where angular measurements might become less meaningful.
Keep exploring
What we’ve verified
Access, alerts and repainting behaviour have not been independently verified for this indicator. Check the creator’s current publication and settings.
General descriptions and classifications are recovered research. Verified details above identify the specific checks we have completed. Check the creator’s current publication for later changes.