
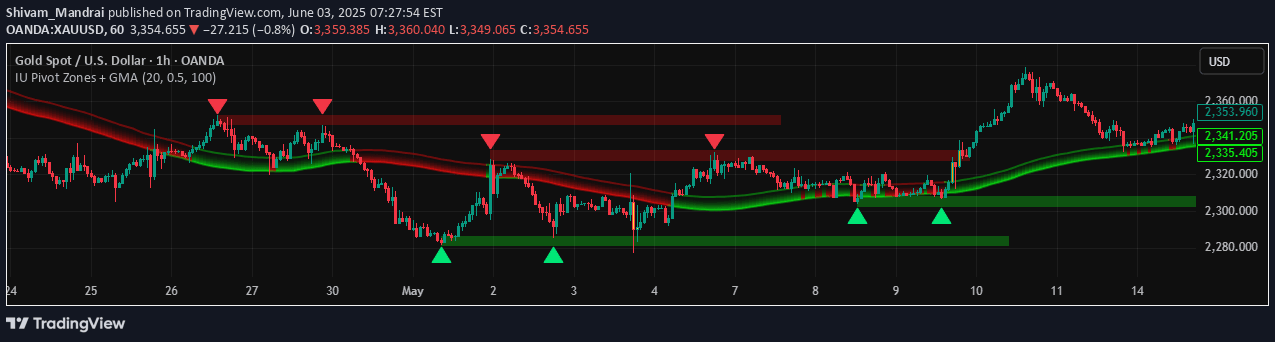
An advanced trading indicator that detects dynamic support and resistance zones using pivot points, geometric moving averages, and real-time price action analysis to help traders identify potential market movements.
Explore complementary indicator rolesHow it works
The IU Pivot Zones + GMA indicator first identifies pivot highs and lows using a user-defined length, then compares these levels to determine valid support and resistance zones based on Average True Range (ATR). It dynamically plots color-coded boxes representing these zones, with red for resistance and green for support, which update in real-time according to price interactions.
Simultaneously, the indicator calculates Geometric Moving Averages (GMA) using a logarithmic mean of highs and lows, providing a smooth trend overlay. When price touches specific zone boundaries, candles are color-coded to enhance visual identification of potential market reactions, with yellow and orange candles signaling important zone interactions.
Why it may be useful
This indicator offers traders a comprehensive visual tool that combines multiple analytical techniques into a single, adaptive framework. By integrating structural levels, volatility filters, and trend indicators, it provides a more nuanced view of potential market movements than traditional single-dimensional analysis methods.
The logarithmic-based GMAs and ATR-adaptive zone logic make this tool more responsive to changing market conditions compared to fixed-width indicators. Traders can quickly identify high-probability zones, confirm trend directions, and receive real-time visual alerts about potential entry and exit points across different trading timeframes.
When to explore it
The IU Pivot Zones + GMA indicator is most effective in markets with clear directional movements and recognizable price structures. It performs exceptionally well in trading environments where price frequently respects support and resistance levels, such as forex, futures, and liquid stock markets with consistent volatility patterns.
Traders should utilize this tool when seeking to develop price action strategies that rely on zone touches, breakouts, or rejections. It is particularly valuable for intraday, swing, and positional traders who want a comprehensive view of market structure and trend dynamics, helping them make more informed trading decisions across multiple timeframes.
Keep exploring
What we’ve verified
Access, alerts and repainting behaviour have not been independently verified for this indicator. Check the creator’s current publication and settings.
General descriptions and classifications are recovered research. Verified details above identify the specific checks we have completed. Check the creator’s current publication for later changes.


