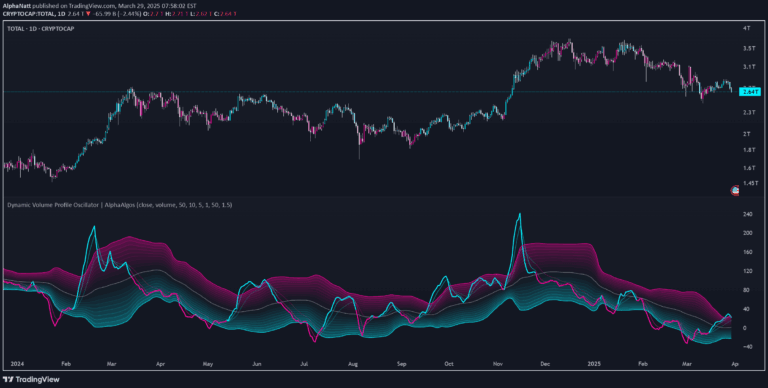
Advanced support and resistance indicator that automatically identifies high-confidence trading levels using proximity, bounce frequency, and volume clustering across multiple markets.
Explore complementary indicator rolesHow it works
The script employs a sophisticated scanning mechanism that identifies potential support and resistance zones by analyzing recent price action, including highs, lows, and key moving averages like SMA50 and SMA200. It systematically evaluates each potential level through a comprehensive weighted scoring system that prioritizes multiple critical factors.
The scoring mechanism assigns percentage weights to three primary criteria: proximity to current price (50%), bounce count (30%), and volume trading intensity (20%). This multi-dimensional approach ensures that only the most statistically relevant and reliable support and resistance zones are highlighted, providing traders with a data-driven method for identifying potential trading levels.
Why it may be useful
Traditional support and resistance identification methods often rely on subjective interpretation and manual drawing of levels, which can lead to inconsistent and unreliable trading decisions. This script eliminates guesswork by introducing an objective, algorithmic approach to level identification that leverages quantitative analysis and statistical validation.
By combining multiple analytical dimensions, the script provides traders with high-confidence zones that have proven historical significance. The automated process saves considerable time and reduces emotional bias, allowing traders to focus on strategic decision-making rather than manually searching for potential trading levels across different market instruments.
When to explore it
This support and resistance indicator is most effective in markets with clear directional movements and consistent trading patterns, such as forex, cryptocurrency, stocks, and index trading. It performs exceptionally well in both trending and range-bound market conditions, offering versatile application across different trading styles and timeframes.
Traders will find maximum value when using this script for intraday and swing trading strategies, particularly when seeking to identify potential entry, exit, and stop-loss levels. Its adaptability across multiple markets and timeframes makes it a valuable tool for traders looking to enhance their technical analysis with data-driven, statistically robust support and resistance identification.
Keep exploring
What we’ve verified
Access, alerts and repainting behaviour have not been independently verified for this indicator. Check the creator’s current publication and settings.
General descriptions and classifications are recovered research. Verified details above identify the specific checks we have completed. Check the creator’s current publication for later changes.