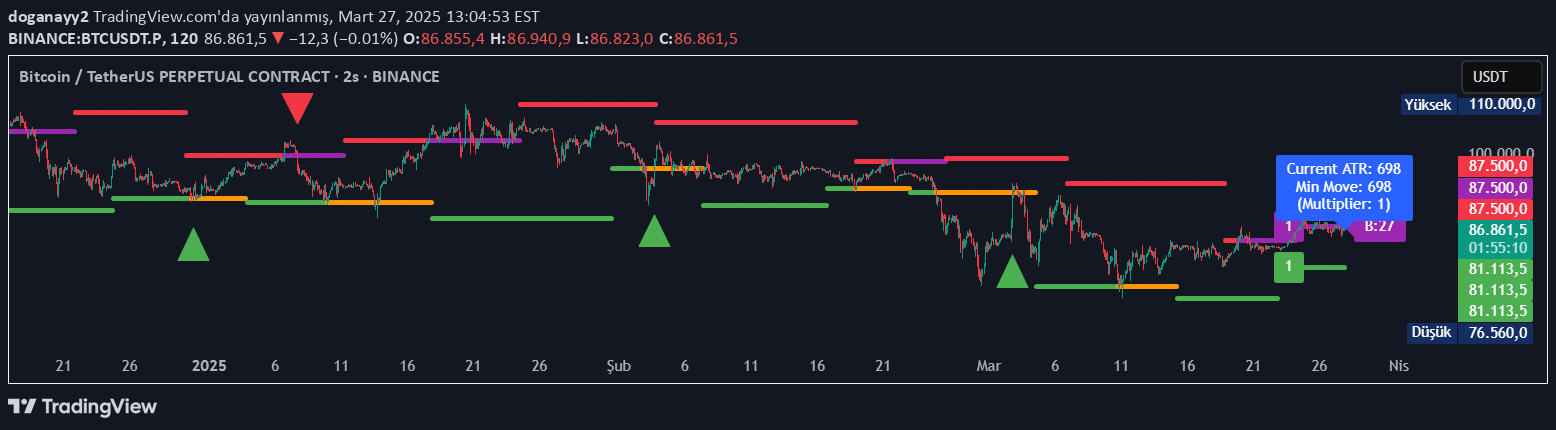
Advanced pivot point indicator that identifies key support/resistance levels using volatility filtering, volume analysis, and liquidity trap detection for precise market entry and exit points.
Explore complementary indicator rolesHow it works
The indicator uses pivot point theory to identify swing highs and lows while applying multiple advanced filters. It calculates pivots based on a specified bar length and validates them through Average True Range (ATR) volatility measurements.
Volume analysis confirms the significance of these levels by checking for unusual trading activity. Wick analysis helps detect potential liquidity traps by examining candle rejections and institutional order flow patterns. The system tracks how many times a level is tested and can flag potential breakouts
Why it may be useful
This indicator provides traders with a sophisticated method of identifying high-probability trading levels beyond traditional pivot point techniques. By filtering out insignificant price movements and requiring volume confirmation, it helps traders focus on meaningful market structures.
The liquidity trap detection adds an institutional trading perspective, revealing potential stop-hunting scenarios. The multi-layered approach reduces false signals and increases the likelihood of identifying strong support and resistance zones
When to explore it
The indicator works best in markets with clear trending or range-bound behavior, particularly for swing and day traders. It is most effective on timeframes from 4-hour to daily charts across liquid markets like forex, stocks, and cryptocurrencies.
Traders should use it alongside other confirmation tools and pay special attention to levels with multiple tests. It is particularly powerful near key psychological price levels, all-time highs/lows, and during periods of potential institutional activity
Keep exploring
What we’ve verified
Access, alerts and repainting behaviour have not been independently verified for this indicator. Check the creator’s current publication and settings.
General descriptions and classifications are recovered research. Verified details above identify the specific checks we have completed. Check the creator’s current publication for later changes.