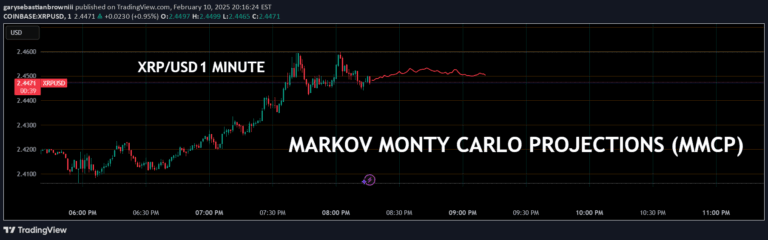
A predictive indicator using historical price data to extrapolate future price points and visualize potential price movements with standard deviation cones for risk assessment.
Explore complementary indicator rolesHow it works
The Price Extrapolator with Deviation Cones calculates the average log return and standard deviation of log returns from historical price data over a specified period. It uses these statistical measurements to generate a central extrapolated price line representing the expected future price movement, along with upper and lower deviation cones that illustrate potential price ranges.
The indicator operates by analyzing past price behavior and transforming those insights into probabilistic future predictions. By adjusting parameters like length, number of future price points, and multiplier, traders can customize the indicator's sensitivity and forecasting range to match their specific trading strategy and market analysis needs.
Why it may be useful
The Price Extrapolator with Deviation Cones provides traders with a visual representation of potential price movements, helping them understand market uncertainty and potential risks. By displaying extrapolated price points and standard deviation bands, the indicator offers insights into possible future price scenarios, enabling more informed decision-making.
This tool is particularly valuable because it transforms complex statistical calculations into an easily interpretable graphical format. Traders can quickly assess the likelihood of different price outcomes, manage risk more effectively, and develop more nuanced trading strategies based on the indicator's probabilistic predictions.
When to explore it
The Price Extrapolator with Deviation Cones is most effective in markets with relatively stable historical price patterns and moderate volatility. It works best when traders want to gain insights into potential future price movements while understanding the associated uncertainty and risk levels.
Traders should use this indicator in conjunction with other technical and fundamental analysis methods, particularly when seeking to develop a comprehensive view of potential market behavior. It is especially useful for day traders and swing traders who need to assess short to medium-term price potential and want a statistical approach to forecasting.
Keep exploring
What we’ve verified
Access, alerts and repainting behaviour have not been independently verified for this indicator. Check the creator’s current publication and settings.
General descriptions and classifications are recovered research. Verified details above identify the specific checks we have completed. Check the creator’s current publication for later changes.