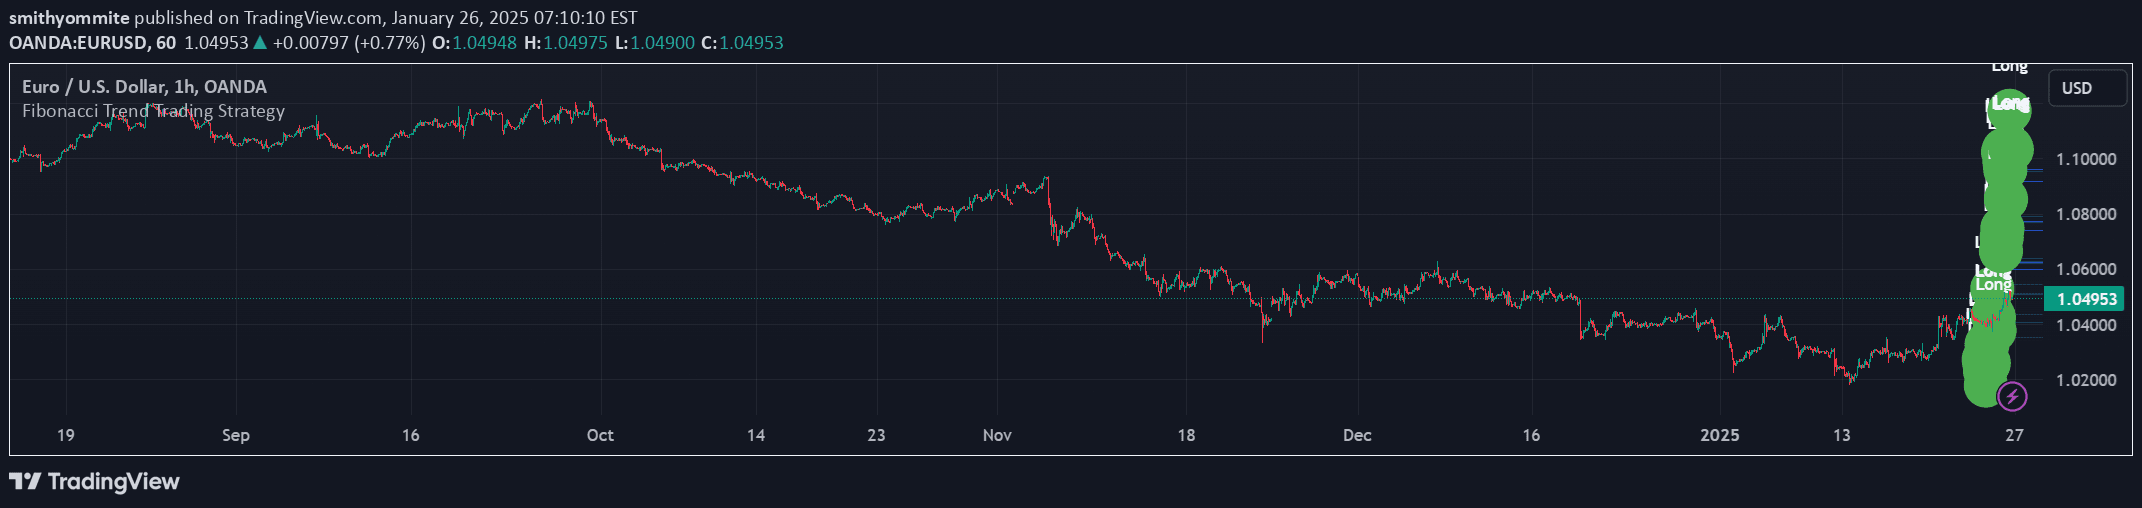
A Fibonacci-based trading tool that identifies market trends, potential reversal levels, and market structure using Fibonacci ratios and trend channels.
Explore complementary indicator rolesHow it works
The Fibonacci Structure & Trend Channel uses Fibonacci ratios to analyze price movements and market structure. It generates a trend line that changes color based on market direction, with green indicating a bullish trend and red signaling a bearish trend.
The indicator plots Fibonacci retracement levels and a channel that helps traders identify potential support and resistance zones. By calculating these levels algorithmically, the tool provides a visual representation of market dynamics and potential price action points.
Why it may be useful
Fibonacci-based indicators offer traders a systematic approach to understanding market movements and potential trend reversals. They provide a mathematical framework for analyzing price action, helping traders make more informed decisions about entry and exit points.
By visualizing complex market dynamics through Fibonacci ratios, traders can gain insights into potential supply and demand intersections. This approach transforms abstract market data into actionable trading information, allowing for more strategic and precise trading strategies.
When to explore it
The Fibonacci Structure & Trend Channel is most effective in markets with clear trending behavior and recognizable price structures. It works particularly well in forex, stocks, and cryptocurrency markets where price movements tend to respect Fibonacci levels.
Traders should use this tool when seeking to identify potential trend reversals, confirm existing trends, or find strategic entry and exit points. It is especially useful during periods of market consolidation or when price is approaching key Fibonacci retracement levels.
Keep exploring
What we’ve verified
Access, alerts and repainting behaviour have not been independently verified for this indicator. Check the creator’s current publication and settings.
General descriptions and classifications are recovered research. Verified details above identify the specific checks we have completed. Check the creator’s current publication for later changes.