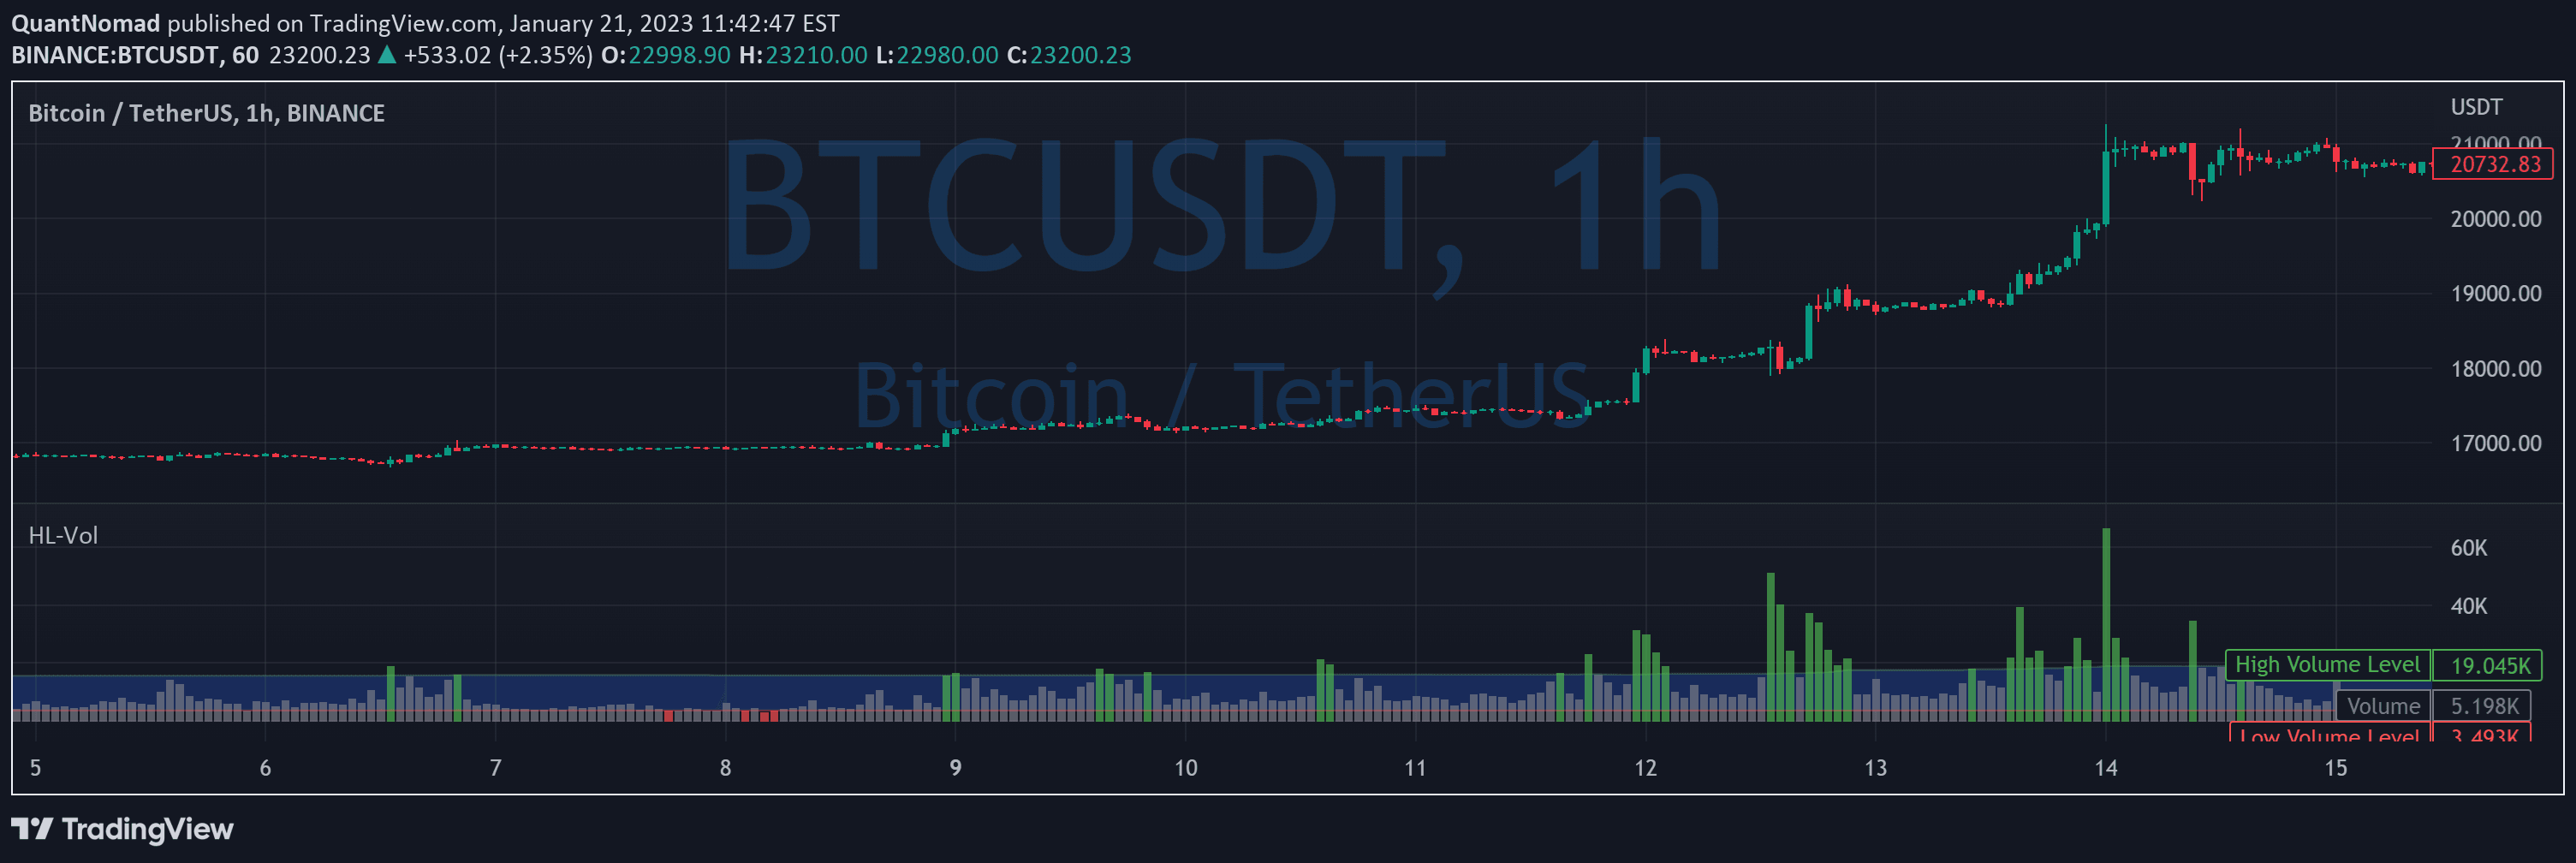
The Relative Volume Index analyzes real-time trading volume against historical averages, helping traders identify unusual market activity and potential trading opportunities through advanced volume analysis.
Explore complementary indicator rolesHow it works
The Relative Volume Index calculates current trading volume by comparing it to historical volume averages across specific time periods. It generates statistical bands and a moving average line to track volume deviations, creating a comprehensive visualization of volume dynamics.
The indicator uses a dynamic color gradient to represent volume strength, with different colors and intensities signaling varying levels of market activity. By computing statistical metrics and comparing real-time volume against established baselines, traders can quickly assess whether current trading volume is typical or exceptional.
Why it may be useful
Volume analysis is crucial for understanding market momentum and potential price movements, as trading volume often precedes significant price changes. The Relative Volume Index provides traders with a sophisticated tool to interpret market activity beyond simple price action, offering insights into underlying market sentiment and potential trend reversals.
By quantifying volume relative to historical patterns, traders can make more informed decisions about market entry and exit points. The indicator helps identify periods of unusual trading activity that might signal important market transitions or potential trading opportunities.
When to explore it
The Relative Volume Index works best during regular market hours with liquid instruments that demonstrate consistent volume patterns. Traders should use this indicator when seeking to confirm price movements, identify potential trend reversals, or assess market sentiment through volume analysis.
It is most effective when combined with other technical indicators and price action analysis. The indicator provides optimal signals in markets with reliable volume data and should be used cautiously during pre-market or post-market trading sessions when volume characteristics might be atypical.
Keep exploring
What we’ve verified
Access, alerts and repainting behaviour have not been independently verified for this indicator. Check the creator’s current publication and settings.
General descriptions and classifications are recovered research. Verified details above identify the specific checks we have completed. Check the creator’s current publication for later changes.